


Abstract
Studies of obesity with or without metabolic aberrations, commonly termed metabolically unhealthy or healthy obesity, in relation to cancer risk are scarce.
We investigated body mass index (normal weight, overweight, obesity) jointly and in interaction with metabolic health status in relation to obesity-related cancer risk (n = 23 630) among 797 193 European individuals. A metabolic score comprising mid-blood pressure, plasma glucose, and triglycerides was used to define metabolically healthy and unhealthy status. Hazard ratios (HRs) and multiplicative interactions were assessed using Cox regression, and additive interactions were assessed using the relative excess risk for interaction. All statistical tests were 2-sided.
Metabolically unhealthy obesity, with a baseline prevalence of 7%, was, compared with metabolically healthy normal weight, associated with an increased relative risk of any obesity-related cancer and of colon, rectal, pancreas, endometrial, liver, gallbladder, and renal cell cancer (P < .05), with the highest risk estimates for endometrial, liver, and renal cell cancer (HR = 2.55-3.00). Metabolically healthy obesity showed a higher relative risk for any obesity-related cancer and colon (in men), endometrial, renal cell, liver, and gallbladder cancer, though the risk relationships were weaker. There were no multiplicative interactions, but there were additive, positive interactions between body mass index and metabolic health status on obesity-related and rectal cancer among men and on endometrial cancer (P < .05).
This study highlights that the type of metabolic obesity phenotype is important when assessing obesity-related cancer risk. In general, metabolic aberrations further increased the obesity-induced cancer risk, suggesting that obesity and metabolic aberrations are useful targets for prevention.
Obesity is an established risk factor for several cancers (1,2). It is often accompanied by metabolic aberrations, which have been a commonly proposed mechanism to link obesity with cancer (3,4). The metabolic syndrome, a cluster of conditions including obesity and metabolic aberrations, has been shown to be associated with an increased risk of some obesity-related cancers (5,6), such as pancreatic (5-9), postmenopausal breast (5,10), liver (5,6,11,12), colorectal (5,6,13,14), endometrial (5,6,15,16), and renal cell cancer (6,17).
During the last decade, obesity with or without metabolic aberrations, commonly termed metabolically unhealthy or healthy obesity, has been extensively investigated in the cardiovascular field (18-20); however, studies regarding cancer are limited. A meta-analysis published in 2020 showed an increased risk of cancer among metabolically healthy obese individuals, but it was based on only 7 studies of different cancer forms and did not summarize the findings for other combinations of body size and metabolic health status (21). A recent prospective study did this and suggested that the impact of obesity on cancer risk varies by metabolic health status and cancer form (22); however, more evidence is needed for specific cancers. Moreover, the potential interaction between body size and metabolic health status on obesity-related cancer risk has been sparsely investigated. Knowledge on this could clarify whether obesity and metabolic aberrations jointly exhibit a greater cancer risk than their individual parts, thereby identifying groups of individuals who are more likely to benefit from interventions aiming at reducing their risk of cancer (23).
In this pooled cohort study, we comprehensively and systematically investigated the association of metabolically unhealthy and healthy overweight and obesity with the risk of obesity-related cancer overall and for specific sites. We specifically examined whether overweight and obesity conveyed an increased risk of obesity-related cancer in metabolically healthy individuals and whether multiplicative and additive interactions existed between body mass index (BMI) and metabolic health status on obesity-related cancer risk.
Methods
Study population
We used data from the Metabolic Syndrome and Cancer Project (Me-Can) 2.0, which is a pooling of 6 cohorts from Norway (Oslo study 1, Norwegian Counties Study [NCS], and the Age 40-Programme [40-y]), Sweden (Västerbotten Intervention Project and Malmö Preventive Project), and Austria (Vorarlberg Health Monitoring and Prevention Programme). Me-Can 2.0 is a follow-up of Me-Can 1.0, which has been described in detail elsewhere (24). Me-Can 2.0 includes more individuals, observations, and follow-up time (25) compared with Me-Can 1.0 but is identical in design. All cohorts are population-based and include information from 1 or more health examinations in individuals performed in 1972-2014. The study was approved by ethics committees in Norway (Regional Committee for Medical and Health Research Ethics, no 2012/2271/REC South-East), Sweden (EPN Umeå, no 2012-354-31M and no 2015-7-32M), and Austria (Ethics Committee of the province of Vorarlberg, no 2006-6/2).
Exposure assessment
The health examinations included measurements of height, weight, blood pressure, and plasma levels of glucose and triglycerides. Many individuals in the Norwegian NCS and 40-y cohorts had missing glucose information during years when it had not been measured, as indicated in Supplementary Table 1 (available online). Therefore, we assumed that glucose was missing at random in these cohorts and that differences in smoking prevalence and blood pressure level between individuals with and without glucose information was explained by Norwegian time trends of these factors (26,27). In these 2 cohorts, we implemented the multiple imputation approach (28) to glucose levels. We defined obesity as a BMI of at least 30 kg/m2, overweight as BMI 25-29.9 kg/m2, and normal weight as a BMI of 18.5 kg/m2 or more to less than 25 kg/m2. We used a metabolic score to capture metabolic aberrations, calculated as the sum of Z-transformed levels of mid-blood pressure [(systolic blood pressure + diastolic blood pressure)/2] (29), glucose, and triglycerides, with glucose and triglycerides log-transformed because their distributions were skewed. Z-transformation was performed by (level—mean)/standard deviation (SD) within strata of cohort and sex and within fasting time (<4 hours, 4 to <8 hours, and ≥8 hours) for glucose and triglycerides. We also had information on total cholesterol but did not include it in the metabolic score because of its lack of a positive association with cancer risk in this population (30). We dichotomized the metabolic score into healthy or unhealthy metabolic status. The definition and prevalence of metabolically unhealthy have varied largely between studies (31). We defined metabolically unhealthy status as the top tertile of the metabolic score, which yielded a similar prevalence of metabolically unhealthy status as in some other European studies (18,32,33). Individuals were categorized into 6 groups by combining categories of BMI (normal weight, overweight, obese) and metabolic health status (metabolically unhealthy, metabolically healthy), with metabolically healthy normal weight as the reference in all analyses.
Follow-up
Cancer diagnoses were identified by linking each individual to the respective national cancer register. Death and emigration (in Norway and Sweden) were captured in each national cause of death and population register. Follow-up for these linkages ended on December 31, 2012, in Norway, and on December 31, 2014, in Sweden and Austria. Obesity-related cancers were defined as those concluded with strong or highly suggestive evidence of being related to obesity in an umbrella review by Kyrgiou et al. (1): esophageal adenocarcinoma (International Classification of Diseases, 7th/10th edition code 150/C15, of adenocarcinoma histologic subtype), stomach-cardia (151.1/C16.0), colon (153/C18), rectum and anus (154/C19-21), liver and intrahepatic bile ducts (155.0/C22), gallbladder and biliary tract (155.1-155.3/C23-24), pancreas (157/C25), postmenopausal breast (170/C50, and attained age of 55 years or older), endometrium (172/C54), ovary (175.0/C56), renal cell (180.0, 180.9/C64), and multiple myeloma (203/C90). Later Continuous Update Project reports on single cancer forms performed by the World Cancer Research Fund confirmed these cancers to be obesityrelated. In our study, “endometrial cancer” denotes the slightly larger group uterine corpus cancer. Esophageal adenocarcinoma and stomach-cardia cancer had less than 400 cases each and were grouped as “other” obesity-related cancers.
Selection criteria
Me-Can 2.0 includes 843 531 individuals with 1 557 855 health examinations (observations). We excluded 173 491 observations with missing information on BMI, blood pressure, glucose (except from the NCS and 40-y cohorts), triglycerides or fasting status; extreme values of height, weight, or BMI; BMI less than 18.5 kg/m2; mismatching dates; or a prevalent cancer (excluding carcinoma in situ and basaliomas). In the remaining 797 193 individuals, we selected the first observation as the baseline (Supplementary Figure 1, available online).
Statistical analysis
We used multivariate normal regression with 10 imputations to obtain imputed glucose levels in the NCS and 40-y cohorts (28). Besides covariates used in the Cox model (see below), obesity-related cancer diagnosis, fasting status, and diabetes were also included as predictors in the model.
We calculated relative and absolute risk measures of obesity-related cancer by combinations of BMI and metabolic health status in the form of hazard ratios (HRs) and cumulative risks, respectively. Hazard ratios with 95% confidence intervals (CIs) were calculated from Cox regression models with person-years at risk counted from the date of health examination until the diagnosis of an obesity-related cancer or until censoring because of another cancer, death, emigration, or until the end of follow-up, whichever came first. For postmenopausal breast cancer, person-years were counted from age 55 years onward or from the date of health examination if this occurred after the 55th birthday. We used age as the underlying time metric and stratified all models by cohort and date of birth (1931, 1931-1938, 1939-1946, 1947-1954, 1955). We adjusted all analyses for sex, baseline age (continuous), and smoking (never smoker, ex-smoker, current smoker <20 pack-years, current smoker ≥20 pack-years, current smoker with pack-years missing, smoking status missing). We examined the interaction between sex and the BMI-metabolic health status variable by adding product terms of sex and all other covariates in the Cox model as suggested by Buckley et al. (34). For cancers indicating an interaction between sex and the BMI-metabolic health status variable (P < .05), only sex-specific hazard ratios were reported. Sex-specific hazard ratios of common obesity-related cancers (>1000 cases) were calculated using the same model, but without adjustment for sex. Schoenfeld residuals statistics were used to test the proportional hazards assumption of the Cox models. Sex violated the proportional hazards assumption in some models; however, including sex as a stratum did not substantially alter hazard ratios, so we did not use this stratum.
We calculated sex-specific cumulative incidence across age for common obesity-related cancers in metabolically unhealthy obesity, metabolically healthy obesity, metabolically unhealthy normal weight, and metabolically healthy normal weight groups using competing risk analysis (35). Age was used as time metric, and death was the competing event.
Interactions between categories of BMI and metabolic health status on obesity-related cancer risk were calculated to assess whether the estimated joint risk or relative risk of the 2 exposures was greater than the sum of their individual (relative) risks. Multiplicative interaction was tested using the Wald test of the product term in the Cox model. The relative excess risk due to interaction was used to calculate additive interaction (23) with confidence intervals calculated using the delta method (36).
All analyses were performed using Stata 16.1 (StataCorp LLC, College Station, TX, USA), and all tests were 2-sided.
Results
The 797 193 individuals (397 082 women, 400 111 men) in the study had a mean baseline age of 42.8 (SD = 9.1) years (Table 1). Mean BMI was 25.2 (SD = 3.8) kg/m2, and overweight and obesity were prevalent in 35% (n = 281 538) and 10% (n = 81 423) of the population, respectively. Metabolically healthy normal weight and metabolically unhealthy obesity represented 42% (n = 334 924) and 7% (n = 54 238) of all individuals. After up to 40 years of follow-up (mean = 19.7 [SD = 7.8]), 23 630 cases of obesity-related cancer (16 114 in women, 7516 in men) had been registered.
Baseline characteristics of the study population after multiple imputationsa
| Characteristics | Total | Normal weightb | Overweightb | Obeseb | |||
|---|---|---|---|---|---|---|---|
| Metabolically healthyc | Metabolically unhealthyc | Metabolically healthyc | Metabolically unhealthyc | Metabolically healthyc | Metabolically unhealthyc | ||
| Total, No. (%)d | 797 193 (100.0) | 334 924 (42.0) | 99 308 (12.5) | 158 595 (19.9) | 122 943 (15.4) | 27 185 (3.4) | 54 238 (6.8) |
| Cohort, year of baseline examination, No. (%) | |||||||
| Oslo, 1972-1973 | 17 577 (2.2) | 7940 (2.4) | 2406 (2.4) | 3392 (2.1) | 3086 (2.5) | 176 (0.6) | 577 (1.1) |
| NCS, 1974-1988 | 89 990 (11.3) | 39 233 (11.7) | 14 701 (14.8) | 15 784 (10.0) | 13 503 (11.0) | 2041 (7.5) | 4728 (8.7) |
| 40-y, 1985-1999 | 392 561 (49.2) | 161 660 (48.2) | 52 621 (53.0) | 80 920 (51.0) | 60 970 (49.6) | 12 737 (46.9) | 23 653 (43.6) |
| VHM&PP, 1985-2005 | 171 713 (21.5) | 77 964 (23.3) | 18 126 (18.3) | 29 745 (18.8) | 25 916 (21.1) | 5861 (21.6) | 14 101 (26.0) |
| VIP, 1985-2014 | 96 294 (12.1) | 34 895 (10.4) | 7732 (7.8) | 23 307 (14.7) | 15 049 (12.2) | 5661 (20.8) | 9650 (17.8) |
| MPP, 1974-2006 | 29 058 (3.7) | 13 232 (4.0) | 3722 (3.7) | 5447 (3.4) | 4419 (3.6) | 709 (2.6) | 1529 (2.8) |
| Sex, No (%) | |||||||
| Male | 400 111 (49.8) | 145 439 (43.4) | 41 298 (41.6) | 100 549 (63.4) | 73 861 (60.1) | 13 926 (51.2) | 25 038 (46.2) |
| Female | 397 082 (50.2) | 189 485 (56.6) | 58 010 (58.4) | 58 046 (36.6) | 49 082 (39.9) | 13 259 (48.8) | 29 200 (53.8) |
| Age, y | |||||||
| Mean (SD) | 42.8 (9.1) | 40.5 (8.5) | 44.8 (10.2) | 42.6 (8.1) | 46.3 (10.1) | 42.8 (8.5) | 46.8 (10.1) |
| <30 | 58 083 (7.3) | 40 079 (12.0) | 4243 (4.3) | 8459 (5.3) | 2618 (2.1) | 1457 (5.4) | 1227 (2.2) |
| 30-44 | 555 091 (69.6) | 243 187 (72.6) | 66 735 (67.2) | 116 967 (73.8) | 76 834 (62.5) | 19 656 (72.3) | 31 711 (58.5) |
| 45-59 | 131 944 (16.6) | 41 836 (12.5) | 17 864 (18.0) | 26 065 (16.4) | 27 662 (22.5) | 4687 (17.2) | 13 830 (25.5) |
| ≥60 | 52 075 (6.5) | 9821 (2.9) | 10 466 (10.5) | 7105 (4.5) | 15 828 (12.9) | 1385 (5.1) | 7470 (13.8) |
| Smoking status, No. (%) | |||||||
| Never smoker | 345 123 (43.3) | 149 458 (44.6) | 37 432 (37.7) | 68 893 (43.4) | 50 519 (41.1) | 13 039 (48.0) | 25 782 (47.5) |
| Ex-smoker | 200 420 (25.1) | 75 190 (22.4) | 22 568 (22.7) | 45 882 (29.0) | 34 775 (28.3) | 7525 (27.7) | 14 480 (26.7) |
| Current smoker | 248 977 (31.2) | 109 382 (32.7) | 39 084 (39.4) | 43 136 (27.2) | 37 252 (30.3) | 6456 (23.7) | 13 666 (25.2) |
| Smoking intensity, pack-years, No. (%) | |||||||
| <20 | 175 136 (70.3) | 80 933 (74.0) | 27 741 (71.0) | 29 546 (68.5) | 24 107 (64.7) | 4328 (67.0) | 8481 (62.1) |
| ≥20 | 56 292 (22.6) | 20 575 (18.8) | 9141 (23.4) | 10 371 (24.0) | 10 479 (28.1) | 1640 (25.4) | 4086 (29.9) |
| Pack-years missing | 17 549 (7.1) | 7874 (7.2) | 2202 (5.6) | 3219 (7.5) | 2666 (7.2) | 488 (7.6) | 1099 (8.0) |
| Smoking status missing | 2673 (0.4) | 894 (0.3) | 223 (0.2) | 684 (0.4) | 397 (0.3) | 165 (0.6) | 310 (0.6) |
| Body mass index, mean (SD), kg/m2 | 25.2 (3.8) | 22.4 (1.7) | 22.9 (1.7) | 26.8 (1.3) | 27.2 (1.4) | 32.6 (3.0) | 33.4 (3.4) |
| Systolic BP, mean (SD), mmHg | 129.6 (17.1) | 121.5 (13.1) | 139.6 (18.7) | 125.8 (12.5) | 142.5 (17.5) | 126.7 (12.9) | 144.9 (18.9) |
| Diastolic BP, mean (SD), mmHg | 79.4 (10.8) | 74.8 (9.0) | 84.5 (11.0) | 77.3 (9.3) | 86.8 (11.0) | 78.2 (10.0) | 88.3 (11.6) |
| Mid-BP, mean (SD), mmHg | 104.5 (12.9) | 98.1 (9.9) | 112 (13.5) | 101.5 (9.7) | 114.6 (12.9) | 102.5 (10.1) | 116.6 (14.0) |
| Triglycerides, mean (SD), mmol/L | 1.6 (1.1) | 1.1 (0.6) | 2.0 (1.2) | 1.4 (0.8) | 2.5 (1.6) | 1.5 (0.9) | 2.7 (1.8) |
| Glucose, mean (SD), mmol/L | 5.2 (1.2) | 4.9 (2.5) | 6.1 (2.5) | 4.9 (1.5) | 5.9 (2.2) | 4.9 (1.4) | 6.0 (2.0) |
| Fasting status, h, No. (%) | |||||||
| <8 | 490 867 (61.6) | 205 731 (61.4) | 68 753 (69.2) | 97 843 (61.7) | 76 021 (61.8) | 14 413 (53.0) | 28 107 (51.8) |
| ≥8 | 306 326 (38.4) | 129 194 (38.6) | 30 554 (30.8) | 60 753 (38.3) | 46 922 (38.2) | 12 772 (47.0) | 26 131 (48.2) |
| Follow-up time, y | |||||||
| Mean (SD) | 19.7 (7.8) | 20.4 (7.8) | 20.4 (8.0) | 19.2 (7.9) | 19.2 (7.8) | 17.5 (7.9) | 17.5 (7.7) |
| <10 | 77 679 (9.8) | 26 446 (7.9) | 8885 (9.0) | 16 354 (10.3) | 13 402 (10.9) | 4199 (15.5) | 8393 (15.5) |
| 10-19 | 334 775 (42.0) | 133 358 (39.8) | 37 932 (38.2) | 71 303 (45.0) | 53 381 (43.4) | 13 049 (48.0) | 25 752 (47.5) |
| 20-29 | 311 907 (39.1) | 139 641 (41.7) | 42 334 (42.6) | 57 325 (36.1) | 46 602 (37.9) | 8545 (31.4) | 17 460 (32.2) |
| ≥30 | 72 832 (9.1) | 35 480 (10.6) | 10 156 (10.2) | 13 613 (8.6) | 9558 (7.8) | 1392 (5.1) | 2633 (4.8) |
Descriptive statistics of all variables for the 6 metabolic obesity phenotypes were calculated based on 10 imputation datasets. For categorical variables, the number in each group was calculated using the estimated proportion multiplied by the total number. 40-y = Age 40-programme; BMI = body mass index; BP = blood pressure; MPP = Malmö Preventive Project; NCS = Norwegian Counties Study; Oslo = Oslo study 1; VHM&PP = Vorarlberg Health Monitoring and Prevention Program; VIP = Västerbotten Intervention Programme.
Normal weight: 18.5≤BMI < 25 kg/m2; overweight: 25≤BMI < 30 kg/m2; obese: BMI ≥ 30 kg/m2.
Metabolically healthy: middle and lowest tertile of metabolic score; metabolically unhealthy: top tertile of metabolic score. Metabolic score composes equally weights mid-blood pressure, glucose, and triglycerides.
The percentages shown are row percentages.
Figure 1 shows hazard ratios of separate cancers for combinations of BMI and metabolic health status, and Figures 2 and 3 show the corresponding sex-specific hazard ratios for obesity-related cancer overall and separately for common cancers. The hazard ratio for any obesity-related cancer in metabolically unhealthy obesity relative to metabolically healthy normal weight was 1.91 (95% CI = 1.74 to 2.09) in men and 1.43 (95% CI = 1.35 to 1.51) in women. Metabolically unhealthy obesity was also associated with higher relative risks of all separate obesity-related cancers, except multiple myeloma and, in women, rectal, postmenopausal breast, and ovarian cancer. The strongest effect estimates of metabolically unhealthy obesity were found for endometrial cancer (HR = 3.00, 95% CI = 2.65 to 3.39), liver cancer (HR = 2.74, 95% CI = 2.13 to 3.53), and renal cell cancer (HR = 2.55, 95% CI = 2.18 to 2.98). For colon cancer, metabolically unhealthy obesity conveyed a higher risk in men (HR = 1.85, 95% CI = 1.61 to 2.12) than in women (HR = 1.21, 95% CI = 1.05 to 1.39; Pinteraction =.003).
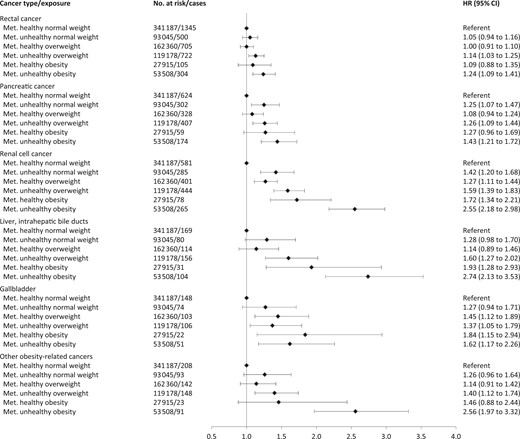
Hazard ratios (95% confidence interval) of obesity-related cancers for specific sites in 797 193 women and men according to combinations of metabolic health status and body mass index. Other obesity-related cancers include esophageal adenocarcinoma and stomach-cardia cancer. Hazard ratios were calculated by use of Cox regression using age as timescale, adjusted for sex, baseline age, and smoking status and pack-years and stratified by cohort and date of birth. Normal weight: 18.5≤BMI < 25 kg/m2; overweight: 25≤BMI < 30 kg/m2; obese: BMI ≥ 30 kg/m2; metabolically healthy: middle and lowest tertile of metabolic score; metabolically unhealthy: top tertile of metabolic score. Metabolic score composes equal weight from mid-blood pressure, glucose, and triglycerides. BMI = body mass index; CI = confidence interval; HR = hazard ratio; Met. = metabolically.
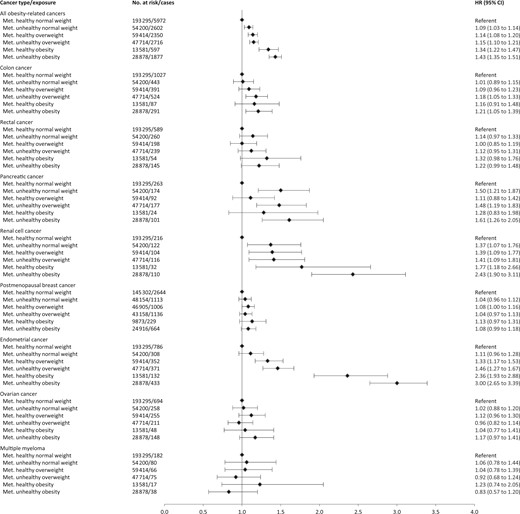
Hazard ratios (95% confidence interval) of all obesity-related cancers and common cancer forms in 397 082 women according to combinations of metabolic health status and body mass index. Hazard ratios were calculated by use of Cox regression using age as timescale, adjusted for sex, baseline age, and smoking status and pack-years and stratified by cohort and date of birth. Normal weight: 18.5≤ BMI < 25 kg/m2; overweight: 25≤BMI < 30 kg/m2; obese: BMI ≥ 30 kg/m2; metabolically healthy: middle and lowest tertile of metabolic score; metabolically unhealthy: top tertile of metabolic score. Metabolic score composes equal weight from mid-blood pressure, glucose, and triglycerides. BMI = body mass index; CI = confidence interval; HR = hazard ratio; Met. = metabolically.
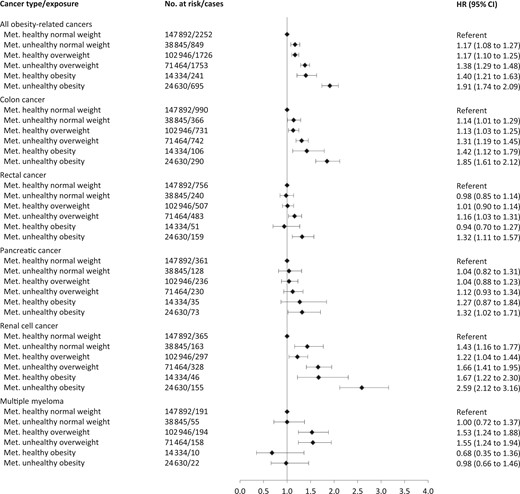
Hazard ratios (95% confidence interval) of all obesity-related cancers and common cancer forms in 400 111 men according to combinations of metabolic health status and body mass index. Hazard ratios were calculated by use of Cox regression using age as timescale, adjusted for sex, baseline age, and smoking status and pack-years and stratified by cohort and date of birth. Normal weight: 18.5≤BMI < 25 kg/m2; overweight: 25≤BMI < 30 kg/m2; obese: BMI ≥ 30 kg/m2; metabolically healthy: middle and lowest tertile of metabolic score; metabolically unhealthy: top tertile of metabolic score. Metabolic score composes equal weight from mid-blood pressure, glucose, and triglycerides. BMI = body mass index; CI = confidence interval; HR = hazard ratio; Met. = metabolically.
In men and women, metabolically healthy overweight and metabolically healthy obesity were associated with increased risks of any obesity-related cancer relative to metabolically healthy normal weight. Specifically, metabolically healthy overweight and metabolically healthy obesity were associated with an increased relative risk of colon (men only), endometrial, renal cell, gallbladder, and liver cancer (metabolically healthy obesity only).
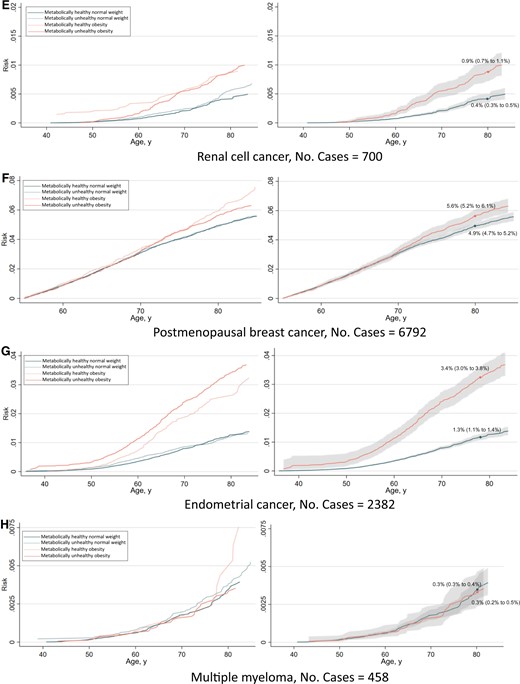
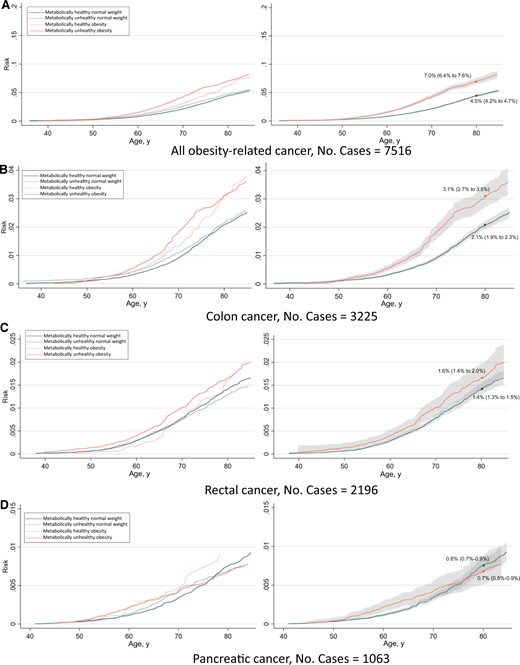
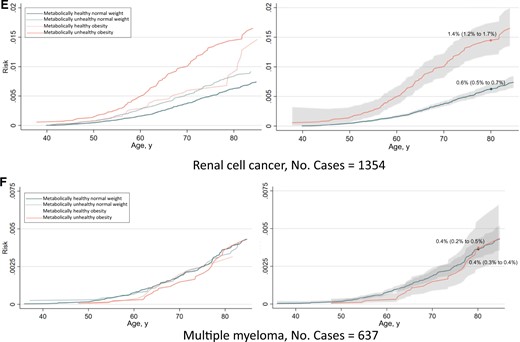
The absolute risk from ages 35 to 85 years of any obesity-related cancer and common cancers separately are shown in Figures 4 and 5. The risk of having developed any obesity-related cancer by age 80 years was 10.7% and 14.4% for metabolically healthy normal weight and metabolically unhealthy obesity, respectively, in women. In men, the corresponding risks were 4.5% and 7.0%. Regarding individual cancers, the largest differences in risk between metabolically healthy normal weight and metabolically unhealthy obese individuals were observed for endometrial cancer and renal cell cancer.
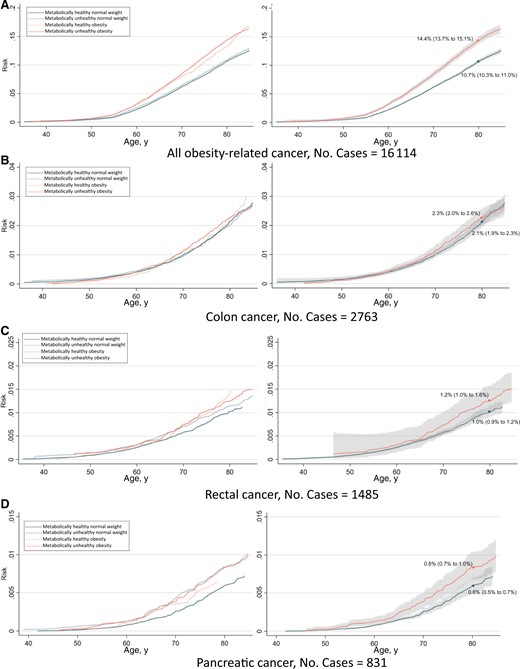
Risk of all obesity-related cancers (A), colon cancer (B), rectal cancer (C), pancreatic cancer (D), renal cell cancer (E), postmenopausal breast cancer (F), endometrial cancer (G), and multiple myeloma (H) among 397 082 women according to combinations of metabolic health status and body mass index. Cumulative risks were calculated using age as time metric and death as competing event. Shaded areas are 95% confidence bands. Absolute risks at age 80 years were calculated using the same model. Normal weight: 18.5≤BMI < 25 kg/m2; obese: BMI ≥ 30 kg/m2; metabolically healthy: middle and lowest tertile of metabolic score; metabolically unhealthy: top tertile of metabolic score. Metabolic score composes equal weight from mid-blood pressure, glucose, and triglycerides. BMI = body mass index.
Continued.
Risk of all obesity-related cancers (A), colon cancer (B), rectal cancer (C), pancreatic cancer (D), renal cell cancer (E), and multiple myeloma (F), among 400 111 men according to combinations of metabolic health status and body mass index. Cumulative risks were calculated using age as time metric and death as competing event. Shaded areas are 95% confidence bands. Absolute risks at age 80 years were calculated using the same model. Normal weight: 18.5≤BMI < 25 kg/m2; obese: BMI ≥ 30 kg/m2; metabolically healthy: middle and lowest tertile of metabolic score; metabolically unhealthy: top tertile of metabolic score. Metabolic score composes equal weight from mid-blood pressure, glucose, and triglycerides. BMI = body mass index.
Continued.
BMI (normal weight, obese) and metabolic health status interacted positively, additively on the risk of any obesity-related (P = .02) and rectal cancer among men (P = .04) and on endometrial cancer (P = .07; Supplementary Table 2, available online). The interaction P value for endometrial cancer lowered to .01 when BMI was split at overweight levels (≥25 kg/m2). These additive interactions were reflected in the absolute risk curves such that the risk difference between metabolically healthy and metabolically unhealthy individuals was larger among obese than normal weight individuals. There were no multiplicative interactions between BMI and metabolic health status on obesity-related cancer risk (Supplementary Table 2, available online).
Hazard ratios of any obesity-related cancer for BMI and metabolic health status categories were similar after excluding the 290 305 individuals with imputed glucose levels in the NCS and 40-y cohorts (Supplementary Table 3, available online). Absolute risks were slightly higher overall in this reduced dataset, which excluded many health examinations from earlier calendar years (Supplementary Table 1, available online).
Discussion
In this European, pooled cohort study, the combination of obesity and metabolically unhealthy status (metabolically unhealthy obesity), based on a score of blood pressure, plasma triglycerides, and glucose, conveyed the highest risk of any obesity-related cancer compared with other combinations of BMI and metabolic health status. The increased risk was found for most obesity-related cancers, with the highest relative risks found for endometrial, liver, and renal cell cancer. For any obesity-related cancer combined and colon (in men), gallbladder, endometrial, liver, and renal cell cancer, obesity remained a risk factor even in a healthy metabolic status (metabolically healthy obesity), although the associations were weakened. Our study also showed positive additive interactions between BMI and metabolic health status on any obesity-related and rectal cancer among men and on endometrial cancer, such that the absolute risk of the 2 factors combined was greater than the sum of their individual risks.
Obesity and metabolic aberrations combined in the metabolic syndrome or in summary scores have been consistently associated with an increased risk of several established obesity-related cancers (5-16). However, there are little data on the added contribution of metabolic aberrations beyond the effect of obesity on cancer risk. In contrast to our findings, a smaller Swedish study found a similarly increased relative risk of any cancer for obesity with or without metabolic aberrations (19). For specific cancers, a European study, which, together with ours, is among the largest in the field, showed that metabolically unhealthy obesity was associated with an increased risk for 10 (9 obesity related) of 22 cancers (22). No associations between metabolically unhealthy obesity and multiple myeloma and ovarian cancer risk in that study were consistent with our results and reflect the modest and inconsistent association between obesity and these cancers in different studies (1). Furthermore, in accordance with our study, the highest relative risks were found for endometrial, liver, and renal cell cancer, with obesity and metabolic aberrations contributing to the increased risks. The similarities in findings between these 2 studies are striking given the different definitions used for metabolically unhealthy status—a metabolic score in our study and the Adult Treatment Panel III definition in the other study. Notwithstanding the various definitions of a metabolically unhealthy status across different studies, they all include components of hypertension, dyslipidemia, and hyperglycemia. These may jointly capture the etiology linking metabolic aberrations with cancer irrespective of the exact components and cut points used, as has been a suggested finding in relation to all-cause and cardiovascular mortality (31,37).
Whether metabolically healthy obesity is related to an increased risk of obesity-related cancer is of particular interest. Insulin resistance and inflammation are hypothesized to promote the development of cancer (3,4); however, metabolically healthy obese individuals have normal insulin sensitivity, lower levels of inflammatory markers, and no evidence of ectopic lipid deposition (38,39). A meta-analysis combining studies of various cancers reported an increased risk for metabolically healthy obesity (21). In the aforementioned European study, metabolically healthy obesity was associated with increased risks of endometrial, kidney, pancreatic, esophageal, and postmenopausal breast cancer (22). The associations for endometrial and kidney (renal cell) cancer are further supported by our study. Our study did not confirm an association between metabolically healthy obesity and postmenopausal breast cancer, possibly because of the modest association between obesity and postmenopausal breast cancer risk in our data (40) as in studies of breast cancer generally (1). Moreover, we found an increased risk of colon cancer in metabolically healthy obese men. Previous studies have either combined colon and rectal cancer or have only investigated women. Although evidence remains limited for separate cancers, emerging evidence suggests that metabolically healthy obesity is associated with increased risks of several cancers, which in our study was approximately 30% higher for any obesity-related cancer compared with metabolically healthy normal weight individuals.
To the best of our knowledge, our study is the first systematic investigation of the interaction between BMI and metabolic health status in relation to the risk of several cancers. The observed positive interactions on the additive scale in relation to any obesity-related and rectal cancer among men and on endometrial cancer suggest that obesity jointly with metabolic aberrations increase the risk of these cancers more than expected from the sum of their individual parts. This has important public health implications, suggesting that a significant number of cancer cases could potentially be prevented by targeting the co-existence of metabolic aberrations and obesity, in particular for obesity-related cancers among men. Metabolically healthy obesity is often a transient status to future metabolic aberrations (38), so early weight-control intervention in metabolically healthy obese individuals is likely most efficient to reduce the disease burden of obesity-related cancers.
This study has several limitations. Firstly, our investigation used single baseline measurements of height, weight, and metabolic factors, which therefore did not account for these factors’ measurement errors and long-term changes, such as transition from metabolically healthy to unhealthy obesity. Furthermore, information on potentially important confounders was incomplete, such as on diet, physical activity, medication use, socioeconomic status, and reproductive factors in women. Also, we used BMI as measure for body size, which does not capture body shape and composition. Last, given the homogeneity of the study sample, the generalizability of our findings to other populations requires further study. Strengths of our study include the large sample size, long follow-up, and capturing of cancer cases in registers with high completeness and validity (41,42).
In conclusion, metabolically unhealthy obesity compared with metabolically healthy normal weight was associated with higher risk of any obesity-related cancer and with several specific cancers. For many of these cancers, obesity remained a risk factor even in individuals with a healthy metabolic status (metabolically healthy obesity), albeit weaker compared with metabolically unhealthy obesity. Furthermore, positive additive interactions were found between BMI and metabolic health status in relation to any obesity-related and rectal cancer among men and endometrial cancer in women. These findings highlight the importance of different types of metabolic obesity phenotypes when assessing the risk of obesity-related cancers, suggesting that both obesity and metabolic aberrations are useful targets for prevention.
Funding
This work was supported by the Crafoord foundation (20220572), the Swedish Cancer Society (CAN 2017/1019) and the China Scholarship Council (202008110188).
Notes
Role of the funder: The funder did not play a role in the design of the study; the collection, analysis, and interpretation of the data; the writing of the manuscript; and the decision to submit the manuscript for publication.
Disclosures: The authors have no disclosures.
Author contributions: MS (conceptualization, formal analysis, funding acquisition, investigation, writing–original draft); JF (conceptualization, investigation, writing–review & editing); CH (conceptualization, investigation, writing–review & editing); TB (data curation, investigation, writing–review & editing); GN (data curation, investigation, writing–review & editing); JM (investigation, writing–review & editing); AE (investigation, writing–review & editing); EZ (investigation, writing–review & editing); BVG (investigation, writing–review & editing); PS (investigation, and writing–review & editing); HU (investigation, writing–review & editing); TS (conceptualization, data curation, funding acquisition, investigation, writing–original draft).
Acknowledgements: We thank all participants of the cohorts. In Norway, we thank the screening team of the former National Health Screening Service of Norway, now the Norwegian Institute of Public Health. We thank the Biobank Research Unit at Umeå University, the VIP and the County Council of Västerbotten for providing data and samples and acknowledge the contribution from Biobank Sweden, supported by the Swedish Research Council (VR 2017-00650). In the MPP, we thank Anders Dahlin, database manager of the cohort. In the VHM&PP, we thank Elmar Stimpfl and Karin Parschalk for excellent technical support.
Data availability
The data that support the findings of this study are available from cohort committees and national registers of the cohorts and countries involved. Restrictions apply to the availability of these data, which were used under license for this study. Data are available after contact with the corresponding author conditional on permission from the involved cohort committees and national registers.

