Carbon isotope values of hazelnut shells: a new proxy for canopy density
 Amy K. Styring
 Elin Jirdén2
  Mikael Larsson
 Karl Ljung
- 1School of Archaeology, University of Oxford, Oxford, United Kingdom
- 2Department of Geology, Lund University, Lund, Sweden
- 3The Archaeologists, National Historical Museums, Lund, Sweden
- 4Department of Archaeology and Ancient History, Lund University, Lund, Sweden
Hazel (Corylus avellana) has been abundant in the vegetation of northern and central Europe since the early Holocene and has provided food and materials for humans ever since. Here we use stable carbon isotope (δ13C) values of hazelnut shells to infer woodland openness based on the premise of the “canopy effect”. It is well established that plants growing in dense, shaded forests have lower carbon isotope (δ13C) values than plants growing in open areas. By measuring δ13C values in hazelnuts collected from trees growing in different levels of light intensity, we show that the canopy effect is preserved in hazelnuts and that their δ13C values can be used to infer woodland openness in the past. We apply the method to hazelnuts recovered from sites dated to between the Mesolithic and Iron Age (c. 7000 BCE−1000 CE) in southern Sweden. Our results show that the nuts dated to the Mesolithic were harvested from hazels growing in a range of closed to open settings while nuts from subsequent periods were harvested from progressively more open environments. Given the abundance of hazelnuts recovered from many archaeological contexts, this method has the potential to reconstruct the microhabitats exploited by humans in the past and explore the impact of humans on their environment.
1 Introduction
Palynological studies show that hazel (Corylus avellana L.) has been continuously present in northern and central Europe since the early Holocene (e.g., Huntley and Birks, 1983; Giesecke et al., 2011). Moreover, hazelnut shells are frequently recovered from archaeological sites, particularly those dated to the Mesolithic and Neolithic (Zvelebil, 1994; Perry, 1999; Regnell, 2012; Bishop et al., 2014), demonstrating their important role in human subsistence. Although their actual importance in past diets is still debated because nutshells are more resistant to charring and other taphonomic processes compared to other plants (Jones, 2000; Bishop, 2019), they have the potential to provide an important source of additional information about the past environments in which hazel trees grew and which humans exploited. Hazelnut shells are also a preferred sample for radiocarbon dating because their carbon was fixed within a single year (Bayliss and Marshall, 2022, p. 36), meaning that any environmental information they do yield can be directly dated.
Stable carbon isotope (δ13C) values of plants are influenced by the ratio of leaf intercellular (ci) to ambient (ca) carbon dioxide concentrations (Farquhar et al., 1982). In C3 plants, this ratio is strongly affected by stomatal conductance and photosynthetic activity, which are in turn affected by water availability and light intensity (Farquhar et al., 1989). When soil moisture levels decrease, stomatal conductance decreases, decreasing the ci and resulting in less negative δ13C values. Numerous studies have observed a negative relationship between C3 plant δ13C values and mean annual precipitation, which flattens off above about 1,000 mm per year (summarized in Kohn, 2010). Light intensity is an additional factor that has been found to influence plant δ13C values, with plants growing in lower light levels having lower rates of photosynthesis, leading to higher ci that results in lower δ13C values (Ehleringer et al., 1986, 1987). Lower δ13C values of plants growing under dense canopy have also been attributed to the recycling of 13C-depleted carbon dioxide, produced by decomposing leaf litter on the forest floor (Vogel, 1978). The observation that plants growing in denser forests have lower δ13C values has been dubbed the “canopy effect” and has been invoked in archaeological studies to attribute variation in wild herbivore bone collagen δ13C values to variability in the density of forest cover (e.g., Bocherens et al., 1999; Cerling and Harris, 1999; Drucker et al., 2008). The δ13C values of archaeological plant remains are rarely considered as a proxy for canopy density, however.
Hazel grows as a multi-stemmed bush in the understorey of deciduous and coniferous forests, but also as isolated trees in wood-pastures. It is generally found in temperate climates with moderate/high annual rainfall (800–1,000 mm; Fideghelli and De Salvador, 2009). There have been numerous studies on the effect of irrigation, fertilizer, and genotype on the characteristics (e.g., protein content, fatty acid profile, morphology) and yield of commercially grown hazelnuts (e.g., Girona et al., 1994; Yao and Mehlenbacher, 2000; Akçin and Bostan, 2018; Külahçilar et al., 2018), but most of these have been in the Mediterranean region where the majority of hazelnuts are now grown commercially. Studies have found that hazel nut yields are sensitive to water stress (Girona et al., 1994; Mingeau et al., 1994; Tombesi and Rosati, 1997), and that the nuts are a strong sink for water during ripening (Bregaglio et al., 2016). It has been posited that their sensitivity to water stress is due to their low capacity for stomatal control and relatively shallow root system (0.4–0.5 m in depth; Portarena et al., 2022). These studies, however, have all been carried out in southern Europe, where rainfall levels are relatively low and water availability is a limiting factor in plant growth. Indeed, a global review of the δ13C values of the leaves and wood tissues of conifers, which also have shallow root systems, concluded that water availability only has a significant effect in seasonally dry climates, where evaporation is greater than precipitation (Warren et al., 2001).
Corylus avellana has been found to be highly adaptable to different light conditions (Catoni et al., 2015), allowing it to grow in both sunny and shaded environments. It seems possible, therefore, that in northern Europe, hazelnut shell δ13C values will be most closely correlated with light levels during the time of fruit formation. According to a study in Denmark, closest to our study region, the fruit (which includes the kernel and nutshell) starts to form in May but does not begin to grow appreciably in size until fertilization takes place at the beginning of July. By the end of July, the shell is fully developed and begins to lignify at the pointed apex. Once the shell is formed, the nut begins to grow quickly and reaches full size in about one month. The fruit then remains on the tree for another month with no further external changes occurring, and during September it will detach itself from the involucre and is ready to harvest. The nut grows from the pointed apex toward the rounded base, known as the hilum (Hagerup, 1942). It can therefore be posited that the carbon routed to the growing nutshell will reflect growing conditions in July.
In this study, we investigate whether the δ13C values of hazelnut shells vary with light levels, governed by canopy density. We collected hazelnuts from trees growing in varying light levels at three locations in southern Sweden (Figure 1). We determine the intra-shell variability in δ13C values, intra-tree variability in δ13C values and the relationship between nutshell δ13C values and light level, measured as the leaf area index (LAI). We collected hazelnuts from the same locations in two subsequent years to preliminarily explore a potential effect of water availability (due to differences in precipitation amount and relative humidity between the years; Table 1) on hazelnut shell δ13C values. This was not the focus of this study, however, and future work needs to be carried out to more thoroughly assess the relative effects of light level and water availability on the δ13C values of hazelnuts in this region. We then determine the δ13C values of hazelnut shells from archaeological sites in southern Sweden, dated to between the Mesolithic and Iron Age (c. 7000 BCE−1000 CE), as a pilot study to gain an initial insight into how the environment—in terms of canopy density—in which people collected hazelnuts changed through time.
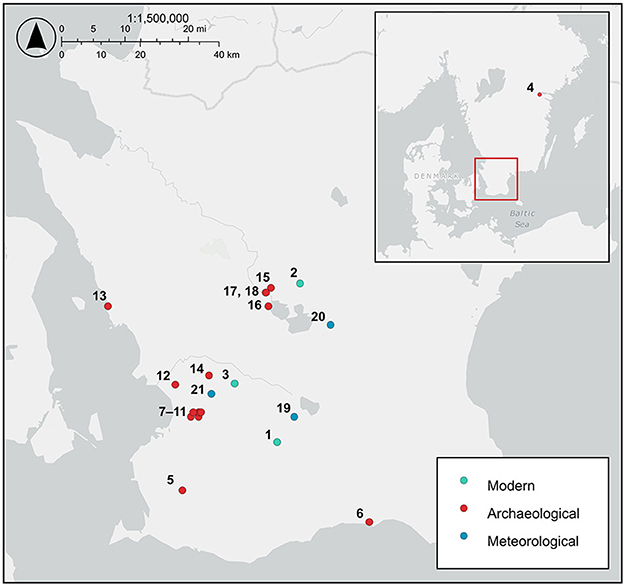
Figure 1. Map of southern Sweden showing the location of the modern hazelnut sampling sites, archaeological hazelnut sampling sites, and meteorological stations providing precipitation, relative humidity, cloud cover, hours of sunshine, and solar radiation data. Sites: 1. Dörröd, 2. Holma, 3. Linnebjer, 4. Fiskeby, 5. Ingelstad 6:1, 6. Ystad VA schaktöverv, 7. Uppåkra regional center, 8. Uppåkra 2:14, 9. Uppråkra 2:25, 10. Hjärup 9:8, 11. Hjärup 7:1, 22:1, 12. Flädie Tankställe Damm, 13. Borstahusen SU 2020, 14. Stångby 5:28, 15. Slabälta 1, 16. Ringsjöholm, 17. Rönneholm 10:3, 18. Rönneholm 6:1, 19. Vomb, 20. Hörby A, 21. Lund Sol.
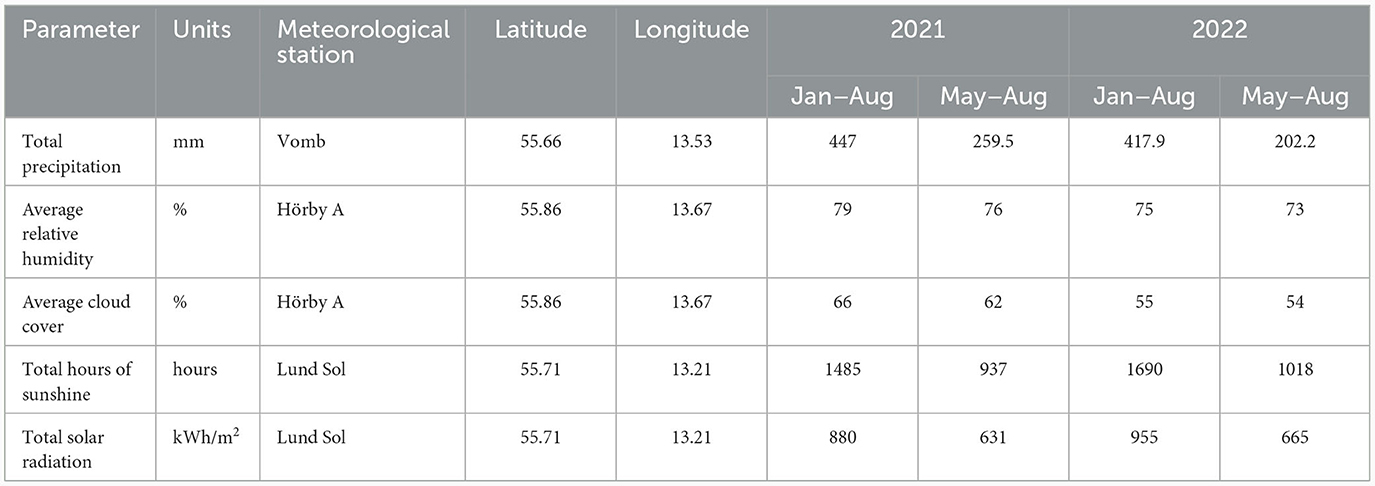
Table 1. Meteorological observations for 2021 and 2022, when hazelnuts were sampled in this study.
2 Materials and methods
2.1 Field sampling methods
Modern hazelnuts were collected on 8th and 10th September 2021 and 16th and 17th September 2022 at three sites in Scania, southern Sweden: Linnebjer nature reserve, Dörröd nature reserve and Holma (Figure 1; Supplementary Table 1). Nuts were collected in between five and ten locations (sub-sites) at each site from individual trees or from the ground below trees. A minimum of three nuts were collected at each sub-site. Where nuts were collected directly from the tree, or there was only one hazel tree in the location, we could use the nuts to establish intra-tree variability. Leaf Area Index (LAI) was measured with a LAI 2000 Plant Canopy Analyzer (PCA, Li-Cor, Lincoln, NE, USA) at each sub-site to determine the density of the canopy. Sample codes comprise a site identifier (L = Linnebjer, D = Dörröd, H = Holma), year (absent = 2021, 22 = 2022), subsite/location identifier (1–10) and nut identifier (1–10). Three of the nuts were cut into three, perpendicular to the axis of growth (see Figure 3), to assess intra-nut variability and were labeled as apex (u), mid (m) and base (o) sections. Precipitation, relative humidity, cloud cover, sunshine time and solar radiation for 1st January to 31st August and 1st May to 31st August 2021 and 2022 were extracted from data provided by the SMHI, Swedish Meteorological and Hydrological Institute (https://www.smhi.se/data/meteorologi/ladda-ner-meteorologiska-observationer; Table 1).
2.2 Sampling of archaeological hazelnut shells
Ten hazelnut shell fragments each from the sites of Slabälta 1, Rönneholm 6:1, Rönneholm 10:3 and Ringsjöholm (Figure 1) were selected for isotope analysis. These shell fragments were preserved by waterlogging and had minimal signs of charring. The sites have been radiocarbon dated to the Mesolithic, between c. 7000 and 5500 BCE, spanning the late Maglemose and Kongemose cultures (Table 2; Sjöström, 1997, 2004, 2013; Larsson and Sjöström, 2010). Charred hazelnut shell fragments were also selected from sites in southern Sweden dated to between the Neolithic and Iron Age (Figure 1; Table 2). The cross-sections of nutshell fragments from Uppåkra, Uppåkra 2:14, Uppåkra 2:25, and Hjärup 9:8 resemble those of modern hazelnut shells experimentally charred for 2 h at less than 320°C (see Holguin et al., 2022) when viewed under a light microscope (Supplementary Figure 1). Unfortunately, none of the other charred nutshells were examined prior to analysis, but their external appearance was similar to those whose cross-sections were examined.
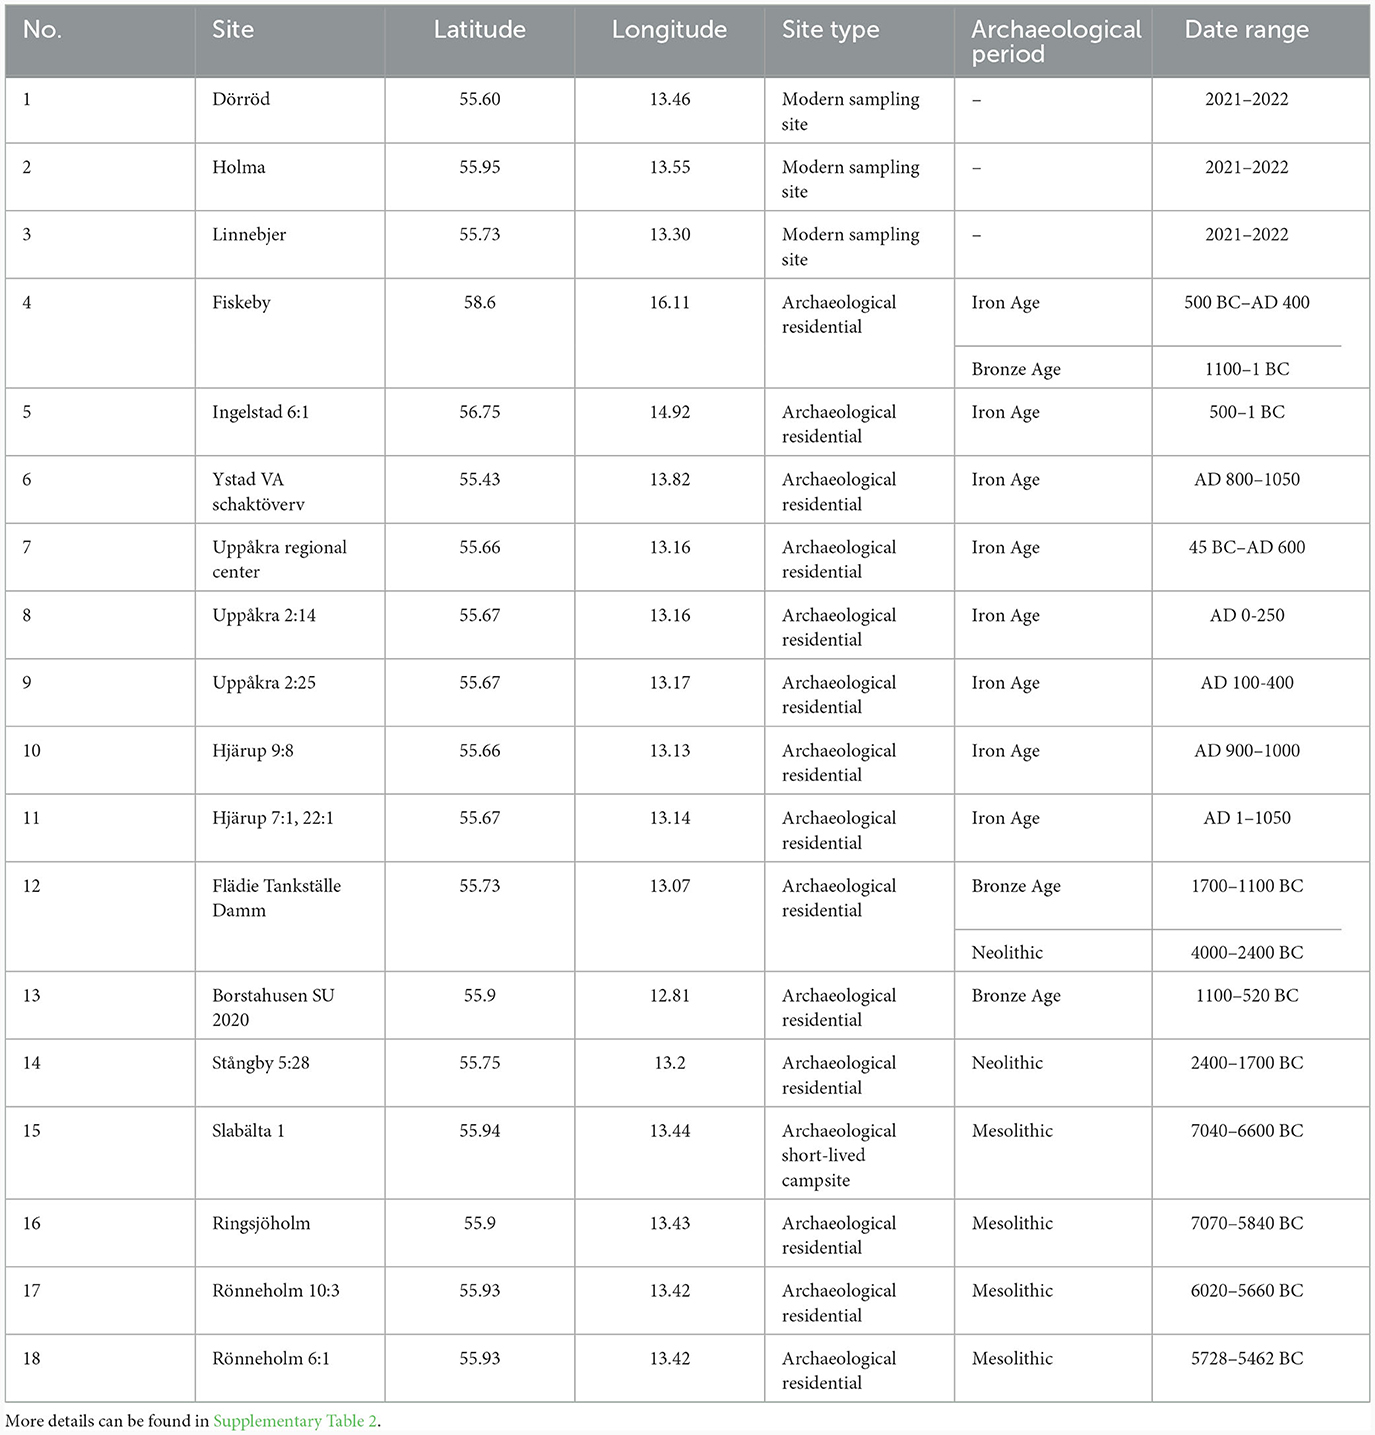
Table 2. Information on modern and archaeological sites from which hazelnuts were sampled for this study.
2.3 Laboratory analysis
Modern hazelnut shells were freeze-dried and crushed using a ball mill. Archaeological nutshell fragments were crushed to a powder, either in an agate mortar and pestle or some of the Mesolithic nutshells with a ball mill. A subset of the crushed nutshells was analyzed using fourier transform infrared spectroscopy with attenuated total reflectance (FTIR-ATR). There are no peaks corresponding to carbonate, nitrate or humic acid contamination (Supplementary Datasheet 1). The charred archaeological nutshells were treated with 10 mL 0.5 M hydrochloric acid at 70°C for 30–60 min, then rinsed in distilled water three times before freeze-drying. Eight (out of forty) archaeological waterlogged hazelnut shells were treated with acid and their δ13C values compared with portions of the same powdered samples that had not been treated. There was no systematic change in the δ13C values with acid treatment and there was a maximum difference in the δ13C value between treated and untreated samples of 0.29‰ (mean = 0.18‰). This is a similar difference to that observed between duplicate carbon isotope measurements on the same homogenized sample of modern hazelnut shells (maximum difference 0.17‰; mean = 0.07‰). It was therefore decided not to proceed with further acid treatment of the waterlogged nutshells.
Approximately 1 mg of each homogenized sample was weighed into tin capsules for carbon isotopic analysis on a Sercon 20–22 isotope ratio mass spectrometer coupled to a Sercon GSL elemental analyser at the Research Laboratory for Archaeology and the History of Art, University of Oxford, UK. Stable carbon isotope values were calibrated to the VPDB scale using Caffeine-2* (δ13C −35.05 ± 0.02‰; University of Indiana) and an internal seal bone collagen reference material (δ13C −12.54 ± 0.13‰). Measurement uncertainty was monitored using two reference materials: alanine (DL alanine, δ13C −27.18 ± 0.16‰; internal reference material from Sigma Aldrich) and spruce (δ13C −25.44 ± 0.02‰; Elemental Microanalysis). Precision [u(Rw)] was determined to be ±0.15‰, accuracy or systematic error [u(bias)] was ±0.19‰ and the total analytical uncertainty was estimated to be ±0.24‰. Raw and normalized isotope data of samples and reference materials are in Supplementary Table 3. The R script for calculating accuracy and precision using data in Supplementary Table 3 is in https://github.com/AmyStyring/Hazelnut-project.
2.4 Data analysis
The Δ13C values of modern hazelnut shells were calculated from the measured δ13C values (δ13Cplant) and an average δ13C value of atmospheric CO2 (δ13Cair) determined from air sampled at weekly intervals during 2020 and 2021 (from Global Monitoring Laboratory https://gml.noaa.gov/dv/iadv/, Pallas-Sammaltunturi station, Finland), using the equation below from Farquhar et al. (1982).
The Δ13C values of archaeological hazelnut shells were calculated from the measured δ13C values (δ13Cplant) and a δ13Cair value approximated by the AIRCO2_LOESS system (Ferrio et al., 2005). The δ13Cair are in Supplementary Tables 1, 2. LAI values were split into three equal bins. Nuts collected from sub-sites with an LAI < 2.65 were assigned to the “open” category of canopy density; those with an LAI of 2.65–5.31 to the “semi-open” category; and those with an LAI > 5.31 to the “closed” category. These designations largely matched those that were subjectively assigned in the field (see Figure 2 for examples of these categories). The minimum LAI for the closed canopy category also aligns with the global mean LAI for temperate broadleaved forests (mean LAI = 5.1; Asner et al., 2003) and so could be considered to be the cut-off between understorey shrubs growing under woodland canopy and those either growing in the open or on the border of woodlands. Since nutshells charred at 320°C for 4 h have been found to have δ13C values that are on average 0.51 ± 0.20‰ higher than their uncharred counterparts (Holguin et al., in prep), we subtract 0.51‰ from the δ13C values of charred nutshells prior to plotting in figures and prior to any statistical analyses in order to make them comparable to the uncharred modern and waterlogged Mesolithic nutshells. There have been no studies of the effect of waterlogging on plant stable isotope values and so we make no adjustment to the δ13C values of the waterlogged hazelnut shells. Statistical analyses were performed in R v.4.2.2 and the R script used is in https://github.com/AmyStyring/Hazelnut-project.

Figure 2. Examples of hazels growing in (A) open, (B) semi-open, and (C) closed canopy environments.
3 Results
3.1 Variability in δ13C values within single hazelnut shells
Figure 3 shows variation in δ13C values within single hazelnut shells. The values vary by up to 0.6‰ within shells (mean = 0.5‰, n = 3). There is no consistent directional change in values from the base to apex of the hazelnut shells, although the base does have a lower δ13C value than the apex in all cases.
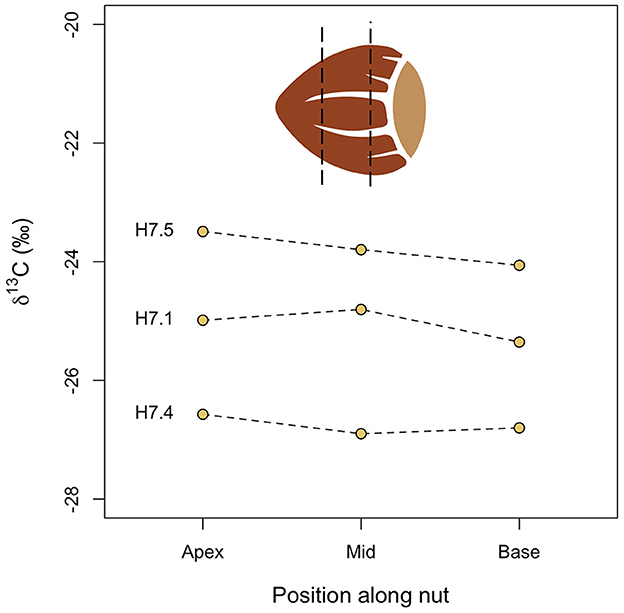
Figure 3. Intra-nutshell variation in δ13C values.
3.2 Variability in hazelnut shell δ13C values within single trees
Figure 4 shows boxplots of the variation in δ13C values of hazelnut shells sampled from single trees. The nutshell values differ by up to 4.9‰ within trees (mean = 3.1‰, n = 9) and the standard deviations in δ13C values within a single tree vary between 0.5 and 2.2‰ (mean = 1.3‰, n = 9). Calculated from the standard error, the 95% confidence interval (CI) of intra-tree variability in hazelnut shell δ13C values varies between ± 0.4 and 1.9‰ (mean = 1.1‰, n = 9).
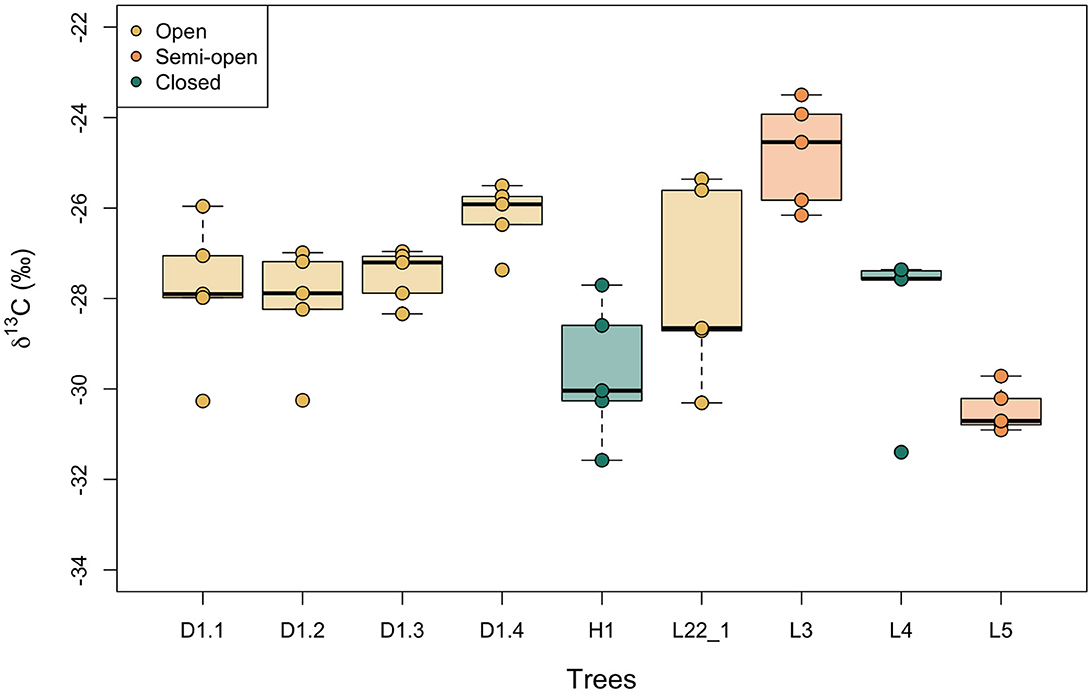
Figure 4. Intra-tree variation in modern nutshell δ13C values. Boxes represent the quartiles, the bold line represents the median and whiskers represent 1.5 × the interquartile range. Trees are color-coded by the density of canopy (open, semi-open, closed) in which they were growing. These categories were assigned by binning the measured LAI values.
3.3 The effect of canopy density on hazelnut shell δ13C values
Figure 5 shows the relationship between hazelnut shell δ13C values and the measured LAI at each sub-site for hazelnuts collected in 2021 and 2022. The δ13C values (n = 192) are normally distributed (W = 0.99, p-value = 0.22). A linear mixed-effects model, including location (sub-site) as a random effect, finds a significant negative relationship between nutshell δ13C values and LAI (Beta = −0.47, SE = 0.07, t = −6.37, p < 0.0001). The model produced a reasonable fit, with a conditional of 0.52 [calculated using r.squaredGLMM (mixed-effects model) in R]. Date was not found to have a significant effect on the relationship and the fit of the model was not improved by adding date as an additional coefficient. The fit of the model was also not improved by nesting location within site.
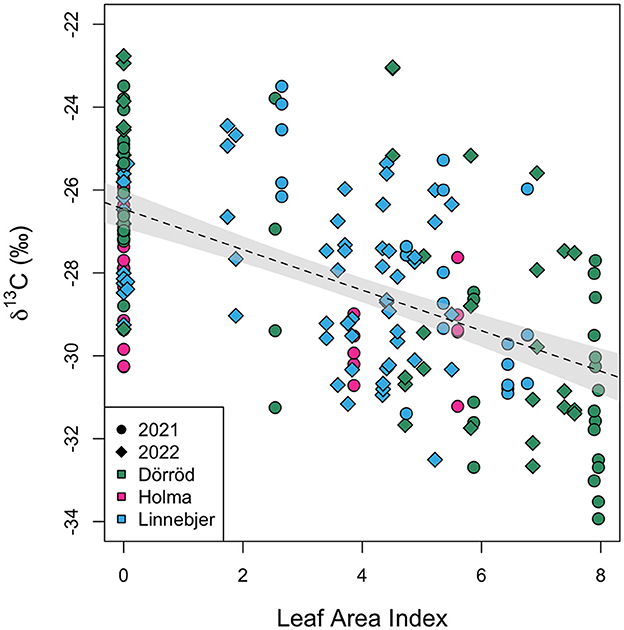
Figure 5. Modern nutshell δ13C values plotted against leaf area index (LAI). Symbols differ by sampling year and are color-coded by site. The dotted line represents a fitted linear model relating δ13C values and leaf area index. The gray shading represents the 95% confidence interval of this relationship.
Figure 6 shows boxplots of the variation in δ13C values of hazelnut shells sampled from trees growing in three different densities of canopy: open, semi-open and closed (see Figure 2 for reference). These categories were assigned using the measured LAI values (see Section 2.4). The δ13C values are normally distributed within categories and Levene's test for equality of variance found that the variances were not statistically different among categories [F(2, 189) = 0.32, p = 0.73]. Nested analysis of variance (with nutshell δ13C values nested by location) found a significant difference in the nutshell δ13C values among the three categories of canopy density (F = 19.93, p < 0.0001). The least squares mean of nutshell δ13C values growing in the open is −26.7‰ (95% CI −27.3 to −26.0‰); of those growing under semi-open canopy is −28.6‰ (95% CI −29.3 to −27.9‰); and of those growing under closed canopy is −29.8‰ (95% CI −30.6 to −29.0‰).
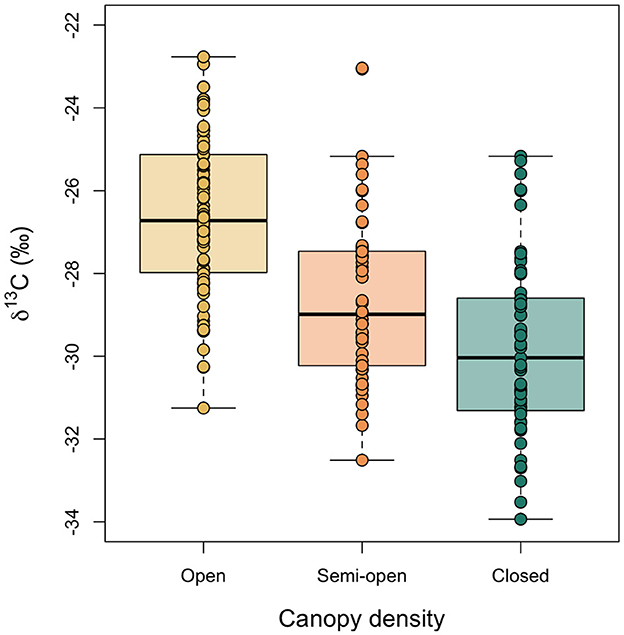
Figure 6. Comparison of modern nutshell δ13C values among trees categorized as growing in open, semi-open and closed environments. Boxes represent the quartiles, the bold line represents the median and whiskers represent 1.5 × the interquartile range.
Although the nested analysis of variance finds a significant difference in the nutshell δ13C values among the three categories of canopy density, we wanted to test the reliability of this model to impute (predict) canopy density from measured δ13C values when the true category of canopy density is unknown (i.e., for archaeological samples). To do this, we split the modern hazelnut δ13C data into a training block and a testing block and fit the regression on the training data. We use the linear regression between δ13C value and category of canopy density with a random effect of location to fit the training data but set the random effect to zero in the prediction step as location identity will be unknown in archaeological data. The imputed canopy density is the category that minimizes the difference between the fitted and observed δ13C values. We split the data at random in the ratio 8:1 training to test and computed the prediction score. The prediction score is the proportion of correctly imputed canopy density levels. We repeated this 1,000 times with independent splits and report the average prediction score (Table 3). The average success rate for the model is 53%, which means that it performs better than random predictions, which would have a success rate of 1/3. The model correctly assigns nutshells to open and closed categories in 69 and 65% of cases, respectively, but performs poorly in correctly assigning nutshells to the semi-open category (only 19% correct assignments). The model performs the same with nutshell Δ13C values, which will be used when applying it to archaeological data.
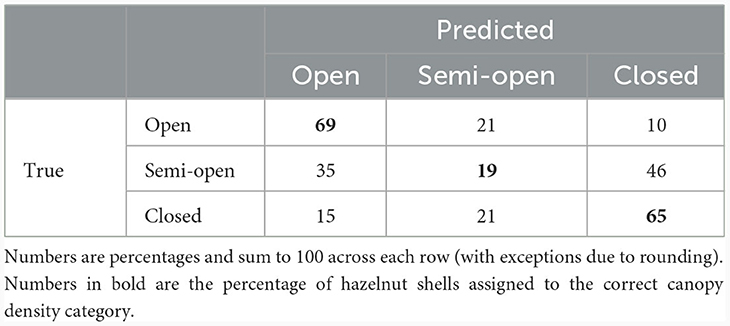
Table 3. Confusion matrix for prediction of canopy density category using modern hazelnut δ13C values split into a training and test dataset.
3.4 Change in archaeological hazelnut shell δ13C values between the Mesolithic and Iron age in southern Sweden
Figure 7 shows boxplots of the Δ13C values of hazelnut shells from the four archaeological sites dated to the Mesolithic in southern Sweden. The archaeological sites are in chronologically ascending order (Slabälta 1 is the oldest and Rönneholm 6:1 and Rönneholm 10:3 are roughly contemporaneous). The measured δ13C values were converted to Δ13C values (see Section 2.4) to account for fluctuations in the δ13C value of atmospheric CO2 over time. We carried out single imputation to assign a category of canopy density (open, semi-open, or closed) to each of the archaeological nutshell fragments. First, we used the modern hazelnut data to model the relationship between openness and Δ13C value (as in Section 3.3, but with Δ13C instead of δ13C value). We then inverted this relationship to impute the missing canopy density value in the archaeological data from their measured Δ13C value. The imputed category of canopy density is the category that minimizes the difference between the fitted and observed Δ13C values for each category. The individual datapoints for archaeological nutshells in Figure 7 are color-coded by their imputed canopy density category.
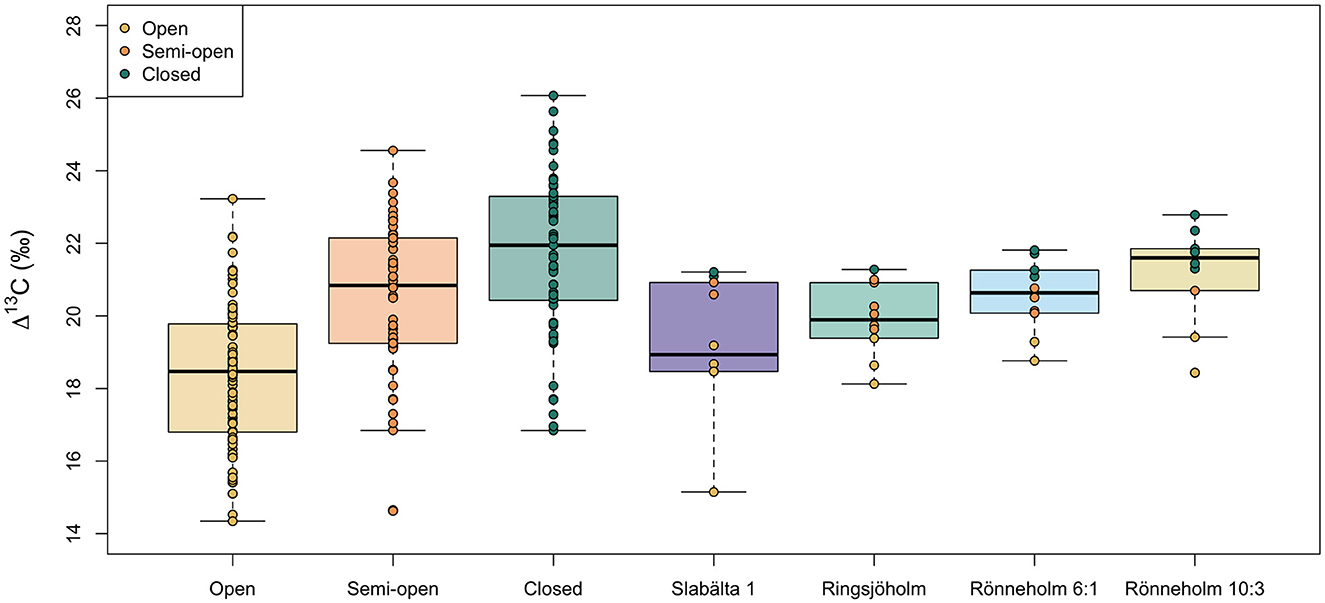
Figure 7. Comparison of modern and Mesolithic nutshell Δ13C values from different growing environments (modern) and sites (archaeological). Boxes represent the quartiles, the bold line represents the median and whiskers represent 1.5 × the interquartile range. Datapoints are color-coded by the canopy density category. For Mesolithic nutshells this category was interpolated from the measured Δ13C values.
The nutshell Δ13C values differ by up to 5.8‰ within sites (mean = 4.0‰, n = 4). This is greater than the variation observed within single trees at the modern study sites. Calculated from the standard error, the 95% confidence interval (CI) of intra-site variability in hazelnut shell Δ13C values varies between ± 0.6 and 1.1‰ (mean = 0.8‰, n = 4). The Δ13C values are normally distributed within sites and Levene's test for equality of variance found that the variances were not statistically different among sites [F(3, 36) = 1.00, p = 0.40]. Analysis of variance found a significant difference in the nutshell Δ13C values among the four sites [F(3, 36) = 4.94, p < 0.05, ω = 0.48]. Post hoc comparisons using the Tukey HSD test indicated that the mean nutshell Δ13C value at Slabälta 1 (mean = 19.2‰, SD = 1.8) is significantly lower than that at Rönneholm 10:3 (mean = 21.2‰, SD = 1.3). While only one of the nutshells from Slabälta 1 is assigned to the closed canopy category, six (out of ten) of the nutshells from Rönneholm 10:3 are assigned to closed canopy.
Figure 8 shows boxplots of the Δ13C values of hazelnut shells from archaeological sites dated to the Mesolithic, Neolithic, Bronze Age and Iron Age in southern Sweden. We carried out single imputation to assign a category of canopy density (open, semi-open, or closed) to each of these archaeological nutshell fragments. The individual datapoints for archaeological nutshells in Figure 8 are color-coded by the imputed canopy density value. The standard deviations in nutshell Δ13C values within time periods are similar (SD = 1.4–1.5‰), apart from the Neolithic, which is only represented by two samples. Further statistical comparisons do not include the Neolithic samples because they are too few. The Δ13C values are not normally distributed within the Mesolithic but Levene's test for equality of variance found that the variances were not statistically different among periods [F(2, 58) = 0.56, p = 0.58]. A Kruskal-Wallis test found a significant difference in the nutshell Δ13C values among the three periods [H(2) = 7.32, p = 0.026]. Jonckheere's test revealed a significant trend in the data: a decrease in median nutshell Δ13C value between the Mesolithic and Iron Age, J = 284, p = 0.014. Comparisons of the mean ranks between periods showed that nutshell Δ13C values are not significantly different between the Mesolithic and Bronze Age (difference = 3.3) or between the Bronze Age and Iron Age (difference = 16.4), but there is a significant difference between the Mesolithic and Iron Age nutshell Δ13C values (difference = 13.2). While 12 (out of 40, or 30%) of the Mesolithic nutshells are assigned to the closed canopy category, only two (out of 18) dated to the Iron Age are assigned to closed canopy.
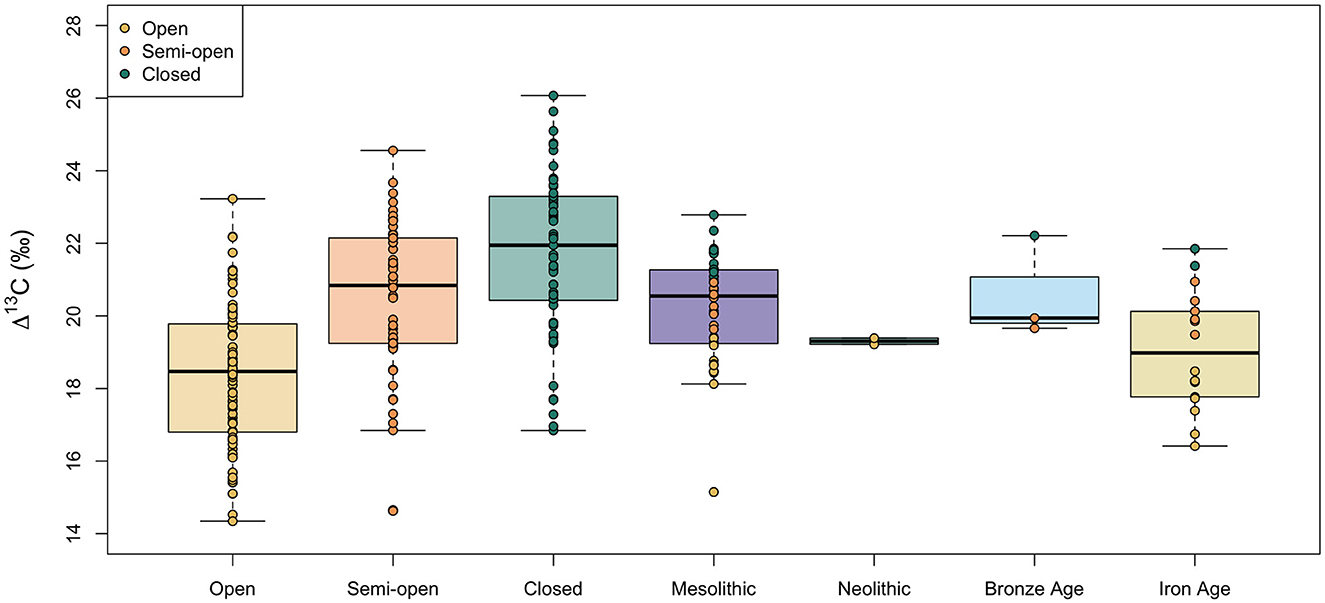
Figure 8. Comparison of modern and archaeological nutshell Δ13C values from different growing environments (modern) and time periods (archaeological). Boxes represent the quartiles, the bold line represents the median and whiskers represent 1.5 × the interquartile range. Datapoints are color-coded by the canopy density category. For archaeological nutshells this category was interpolated from the measured Δ13C values.
4 Discussion
4.1 Variability in hazelnut shell δ13C values within single nuts and trees
The mean 0.5‰ range in δ13C values within a single hazelnut shell (Figure 3) is small compared to the mean 3.1‰ variation in nutshell δ13C values from a single tree (Figure 4) and the total range in hazelnut nutshell δ13C values determined across three sites in southern Sweden (11.2‰; Figure 5). It is therefore unlikely that sampling fragments from random parts of a nutshell will bias δ13C results.
The mean 3.1‰ intra-tree range in nutshell δ13C values (Figure 4) is relatively large and is actually the same as the mean intra-tree range of Corylus avellana pollen δ13C values determined in another study (3.1‰, n = 4; Müller et al., 2020). This suggests that the carbon used to synthesize the lignin and structural carbohydrates (cellulose, hemicellulose) that make up the majority of nutshell (Licursi et al., 2017) is either (i) sourced from different (groups of) leaves that experience different conditions, which influence their stomatal conductance and photosynthetic activity and therefore the level of discrimination against 13C; or (ii) different nuts are formed at slightly different times when conditions that affect 13C-discrimination differ. Given that nuts tend to develop at a similar time within the year (Hagerup, 1942), it seems most likely that carbon being derived from different leaves accounts for the variation in nutshell δ13C values. A study of leaves sampled at different heights (150 leaves were homogenized for each height) within a single beech tree (Fagus sylvatica) found a positive correlation between leaf δ13C values and height. The intra-tree leaf δ13C values had a range of c. 3‰ (Schleser, 1992: Figure 1), but this range is likely to have been higher if the δ13C values of individual leaves had been determined. Hazelnut shells must be a sink for carbon from neighboring leaves as opposed to receiving carbon from a mix of sources, which would lead to much more homogenous hazelnut δ13C values from within a single tree.
In this study we were unable to pick nuts from designated parts of the tree canopy to explore the relationship between nutshell δ13C values and position on the branch, height above the ground and irradiance received by the surrounding leaves, but this could be investigated in the future. Our results indicate that single nutshell fragment δ13C values are only 95% likely to encompass the true tree mean if their confidence range is extended by ±1.1‰ (mean 95% CI of intra-tree variability). Differences in nutshell δ13C values of less than 2.2‰ therefore do not necessarily reflect differences in growing condition and it is recommended that multiple nutshells are sampled from the same context/site/period to adequately characterize the growing conditions. Indeed, to identify a difference in mean nutshell δ13C values between two sites/phases of 3.1‰, which is the difference between δ13C values of modern hazelnuts growing in the open and under closed canopy (Section 3.3), given that the pooled standard deviation of nutshells from a single tree is 1.3‰, four samples from each site/phase are required. To identify a difference in mean nutshell δ13C values between two sites/phases of 1.2‰, which is the difference between δ13C values of modern hazelnuts growing under closed and semi-open canopy (Section 3.3), 20 samples from each site/phase are required. This is with a statistical power of 80% and a significance level of α = 0.05.
4.2 Hazelnut shell δ13C values as a proxy for canopy density?
There is a significant negative correlation between LAI (as a proxy for canopy density) and modern hazelnut shell δ13C values (Figure 5), indicating that hazelnut shell δ13C values can be used to infer the density of the canopy in the environment in which they were collected. The conditional R2 value of 0.52 indicates that 52% of the variation in nutshell δ13C values can be accounted for by canopy density as opposed to other variables. There were slightly lower levels of precipitation and higher levels of solar radiation in 2022 compared to 2021 (Table 1), which could have led to higher nutshell δ13C values due to lower water availability, but these meteorological differences (categorized by the date variable) were not found to have a significant effect on the fit of the linear model regressing nutshell δ13C values and LAI. It cannot be ruled out that more extreme changes in precipitation and solar radiation levels could have a significant effect on nutshell δ13C values and therefore we can only be confident of this relationship for regions with similar climate to modern southern Sweden.
Studies on tree leaf δ13C values have found that they vary with height in the canopy. This variation has been attributed predominantly to light intensity, with leaves in the upper canopy that receive more light having higher δ13C values (Berry et al., 1997; Buchmann et al., 1997; Roberts et al., 1999; Graham et al., 2014). A study by Bonafini et al. (2013) investigated the variation in grass δ13C values growing in differing levels of shade. They found that differences in light intensity had a stronger influence on the δ13C value of the grass tissue than temperature or rainfall. It therefore seems likely that the variation in hazelnut shell δ13C values with LAI are due to differences in the δ13C value of carbon fixed by leaves that discriminate against 13C to varying degrees according to the rate of photosynthesis that is influenced by light levels.
Studies of plant δ13C values growing in differing densities of canopy have determined a depletion in 13C of between 2 and 5‰ between plants growing in open and closed environments (van der Merwe and Medina, 1991; Broadmeadow and Griffiths, 1993; France, 1996; Bonafini et al., 2013). In this study the difference between the mean δ13C values of hazelnut shells growing in the open and those growing under closed canopy is 3.1‰ (−26.7 minus−29.8‰), and between the highest and lowest 95% CI values of hazelnut shells growing in the open and those growing under closed canopy is 4.6‰ (−26.0 minus−30.6‰). Our values are therefore consistent with the results of previous studies.
We have grouped the measured LAI values into three bins, which correspond to open, semi-open and closed canopy environments. These categories are useful because they represent different environments that can be more easily visualized than a gradient of LAI values. Figure 2 shows examples of the three categories. The “open” category can broadly be thought of as trees growing in wood-pastures, with open space around each tree. This is how hazels are cultivated today (e.g., Portarena et al., 2022). The “semi-open” category could encompass hazels growing on the margins of woodlands, with open land on one side, or those growing in woodland clearings, with no canopy directly above them. The “closed” category represents hazels growing as understorey trees/shrubs in woodland. These three settings have different implications for the types of environments in which hazels were growing and in which humans were collecting them. The fact that the δ13C values of hazelnut shells from these three different settings differ significantly means that hazelnut δ13C values are a promising index to differentiate between them.
We tested the reliability of the nested analysis of variance model to impute canopy density from measured δ13C values (Table 3). The model correctly categorizes hazelnut shells into open and closed categories in over 65% of cases but does not perform well in correctly categorizing nutshells into the semi-open category. It is therefore recommended that studies that seek to characterize past hazel growing environments using nutshell δ13C values focus on the relative proportions of nutshells from open and closed environments and refrain from interpreting those that are categorized as having grown in semi-open conditions. Nonetheless, general trends toward higher or lower δ13C values can be interpreted as a shift toward more open or more closed environments because the relationship between nutshell δ13C values and LAI/canopy density is strong and significant.
4.3 Reconstructing changes in hazel growing environments through time
The Δ13C values of hazelnut shells from Mesolithic archaeological sites within 5 km of one another in southern Sweden are found to vary significantly (Figure 7). There is an even split between nutshells from open and closed environments, suggesting that people had access to and exploited a range of wooded and more open environments for their food resources. This aligns with pollen analysis that indicates that southern Sweden was dominated by natural broad-leaved forests with smaller areas of open land throughout the Mesolithic (O'Dwyer et al., 2021). It isn't clear why the Δ13C values of hazelnut shells from Slabälta 1 and Rönneholm 10:3 should differ significantly from one another. Slabälta 1 (7000–6640 BCE) was occupied at least one thousand years before the Rönneholm sites (5728–5462 BCE) and regional pollen-based land cover reconstructions of southern Sweden show that the pine and hazel-dominated vegetation of the early Mesolithic (c. 8500–7500 BCE) was replaced by broad-leaved forest with more abundant Quercus and Tilia from around 7000 BCE (Gaillard, 1984; Berglund et al., 2008; O'Dwyer et al., 2021). The lower Δ13C values of nutshells from Slabälta 1 could therefore possibly be linked to more open vegetation earlier in the Mesolithic.
The decreasing Δ13C values of hazelnut shells from archaeological sites in southern Sweden dated to between the Mesolithic and Iron Age (c. 7000 BCE to 1000 CE) are consistent with hazelnuts being gathered from increasingly open environments (Figure 8). It is possible that this trend could be due to decreasing water availability over this period, leading to decreased stomatal conductance and decreased discrimination against 13C. This is contrary to what is known about the past climate in Sweden, however, with a thermal maximum between c. 6000 and 3000 BCE and a shift to colder and wetter conditions from c. 2000 BCE (Wastegård, 2022), making it unlikely that water availability is the main factor influencing the nutshell δ13C values. Until further studies comprehensively assess the effect of water availability on hazelnut shell δ13C values in this region, however, we cannot rule out the possibility that changes in relative humidity through time had some effect on the archaeological hazelnut shell δ13C values.
If canopy density was the main factor driving the changes in hazelnut shell δ13C values, it seems that by the Iron Age, the vast majority of nuts were being gathered from outside woodlands, perhaps from open wood-pastures. This is consistent with pollen records, which indicate an opening up of the landscape between the Mesolithic and Iron Age, with tree cover decreasing from about 80% in the middle Mesolithic to 30% by the pre-Roman Iron Age (Berglund, 1991; Hellman, 2007; O'Dwyer et al., 2021). The degree of openness did not increase uniformly across southern Sweden, however, with more open land along the coasts in the Bronze Age (Berglund, 2003) and local catchment pollen cores (like wells) showing high variability in tree cover (Lagerås and Fredh, 2020). Pollen records indicate a sudden shift toward a more open landscape in the middle of the Bronze Age (Berglund, 1991; Hellman, 2007; O'Dwyer et al., 2021), and so increasing the number of nutshell carbon isotope measurements from the Bronze Age should be a priority to explore whether there was a shift in the environment in which hazelnuts were gathered at this time. The number of nutshells from Neolithic sites should also be increased. Overall, the Δ13C values of archaeological nutshell fragments provide a new insight into the environments in which hazelnuts were gathered in the past that complement pollen-based reconstructions of overall vegetation cover.
5 Conclusions
The δ13C values of hazelnut shells have been found to vary with canopy density. Stable carbon isotope analysis of hazelnut shells from archaeological sites can therefore be used to provide direct insights into the nature of wooded environments in which people were collecting food resources in the past. This can complement the more general understanding of vegetation cover and density provided by pollen analysis and δ13C values of wild faunal bone collagen that integrate vegetation over a wider area. On Mesolithic and Neolithic sites, where hazelnut shells are abundant, nutshells from discrete palimpsests can help to characterize the microhabitats that were exploited by different groups. In later periods, nutshells with δ13C values indicative of growing in closed canopy environments can identify sites that were in the proximity of more closed woodlands.
Data availability statement
The original contributions presented in the study are included in the article/Supplementary material and the R script used for statistical analyses is in https://github.com/AmyStyring/Hazelnut-project. Further inquiries can be directed to the corresponding authors.
Author contributions
AKS: Conceptualization, Data curation, Formal analysis, Investigation, Methodology, Supervision, Visualization, Writing—original draft, Writing—review & editing. EJ: Data curation, Investigation, Writing—review & editing. PL: Resources, Writing—review & editing. ML: Resources, Writing—review & editing. AS: Resources, Writing—review & editing. KL: Conceptualization, Funding acquisition, Investigation, Methodology, Project administration, Supervision, Writing—original draft, Writing—review & editing.
Funding
The author(s) declare financial support was received for the research, authorship, and/or publication of this article. This study was funded by the Ebbe Kocks Stiftelse (Grant No. EK202t-0021).
Acknowledgments
We are grateful to Amy Holguin for sharing unpublished isotopic data from the experimental charring of hazelnuts and to Peter Ditchfield for technical assistance on the EA-IRMS. We also thank the two reviewers for their insightful comments that have improved the manuscript.
Conflict of interest
The authors declare that the research was conducted in the absence of any commercial or financial relationships that could be construed as a potential conflict of interest.
The author(s) declared that they were an editorial board member of Frontiers, at the time of submission. This had no impact on the peer review process and the final decision.
Publisher's note
All claims expressed in this article are solely those of the authors and do not necessarily represent those of their affiliated organizations, or those of the publisher, the editors and the reviewers. Any product that may be evaluated in this article, or claim that may be made by its manufacturer, is not guaranteed or endorsed by the publisher.
Supplementary material
The Supplementary Material for this article can be found online at: https://www.frontiersin.org/articles/10.3389/fearc.2024.1351411/full#supplementary-material
References
Akçin, Y., and Bostan, S. Z. (2018). Variations in some traits affecting yield in different hazelnut cultivars. Acta Hortic. 1226, 149–152. doi: 10.17660/ActaHortic.2018.1226.21
Asner, G. P., Scurlock, J. M. O., and Hicke, A. J. (2003). Global synthesis of leaf area index observations: implications for ecological and remote sensing studies. Glob. Ecol. Biogeogr. 12, 191–205. doi: 10.1046/j.1466-822X.2003.00026.x
Bayliss, A., and Marshall, P. (2022). Radiocarbon Dating and Chronological Modelling: Guidelines and Best Practice. London: Historic England.
Berglund, B. E. (1991). Landscape reconstruction in south Sweden for the past 6000 years. Proc. Br. Acad. 77, 25–37.
Berglund, B. E. (2003). Human impact and climate changes—synchronous events and a causal link? Quat. Int. Environ. Variabil. East West Eur. 105, 7–12. doi: 10.1016/S1040-6182(02)00144-1
Berglund, B. E., Gaillard, M.-J., Björkman, L., and Persson, T. (2008). Long-term changes in floristic diversity in southern Sweden: palynological richness, vegetation dynamics and land-use. Veget. Hist. Archaeobot. 17, 573–583. doi: 10.1007/s00334-007-0094-x
Berry, S. C., Varney, G. T., and Flanagan, L. B. (1997). Leaf δ13C in Pinus resinosa trees and understory plants: variation associated with light and CO2 gradients. Oecologia 109, 499–506. doi: 10.1007/s004420050110
Bishop, R. R. (2019). Experiments on the effects of charring on hazelnuts and their representation in the archaeological record. J. Archaeol. Sci. Rep. 26:101839. doi: 10.1016/j.jasrep.2019.05.004
Bishop, R. R., Church, M. J., and Rowley-Conwy, P. A. (2014). Seeds, fruits and nuts in the Scottish Mesolithic. Proc. Soc. Antiq. Scot. 143, 9–71. doi: 10.9750/PSAS.143.9.71
Bocherens, H., Billiou, D., Mariotti, A., Patou-Mathis, M., Otte, M., Bonjean, D., et al. (1999). Palaeoenvironmental and palaeodietary implications of isotopic biogeochemistry of last interglacial neanderthal and mammal bones in Scladina Cave (Belgium). J. Archaeol. Sci. 26, 599–607. doi: 10.1006/jasc.1998.0377
Bonafini, M., Pellegrini, M., Ditchfield, P., and Pollard, A. M. (2013). Investigation of the ‘canopy effect' in the isotope ecology of temperate woodlands. J. Archaeol. Sci. 40, 3926–3935. doi: 10.1016/j.jas.2013.03.028
Bregaglio, S., Orlando, F., Forni, E., De Gregorio, T., Falzoi, S., Boni, C., et al. (2016). Development and evaluation of new modelling solutions to simulate hazelnut (Corylus avellana L.) growth and development. Ecol. Modell. 329, 86–99. doi: 10.1016/j.ecolmodel.2016.03.006
Broadmeadow, M. S. J., and Griffiths, H. (1993). “Carbon isotope discrimination and the coupling of CO2 fluxes within forest canopies,” in Stable Isotopes and Plant Carbon-Water Relations, eds J. R. Ehleringer, A. E. Hall, and G. D. Farquhar (San Diego, CA: Academic Press), 109–129.
Buchmann, N., Kao, W.-Y., and Ehleringer, J. (1997). Influence of stand structure on carbon-13 of vegetation, soils, and canopy air within deciduous and evergreen forests in Utah, United States. Oecologia 110, 109–119. doi: 10.1007/s004420050139
Catoni, R., Granata, M. U., Sartori, F., Varone, L., and Gratani, L. (2015). Corylus avellana responsiveness to light variations: morphological, anatomical, and physiological leaf trait plasticity. Photosynthetica 53, 35–46. doi: 10.1007/s11099-015-0078-5
Cerling, T. E., and Harris, J. M. (1999). Carbon isotope fractionation between diet and bioapatite in ungulate mammals and implications for ecological and paleoecological studies. Oecologia 120, 347–363. doi: 10.1007/s004420050868
Drucker, D. G., Bridault, A., Hobson, K. A., Szuma, E., and Bocherens, H. (2008). Can carbon-13 in large herbivores reflect the canopy effect in temperate and boreal ecosystems? Evidence from modern and ancient ungulates. Palaeogeogr. Palaeoclimatol. Palaeoecol. 266, 69–82. doi: 10.1016/j.palaeo.2008.03.020
Ehleringer, J. R., Field, C. B., Lin, Z., and Kuo, C. (1986). Leaf carbon isotope and mineral composition in subtropical plants along an irradiance cline. Oecologia 70, 520–526. doi: 10.1007/BF00379898
Ehleringer, J. R., Lin, Z. F., Field, C. B., Sun, G. C., and Kuo, C. Y. (1987). Leaf carbon isotope ratios of plants from a subtropical monsoon forest. Oecologia 72, 109–114. doi: 10.1007/BF00385053
Farquhar, G. D., Ehleringer, J. R., and Hubick, K. T. (1989). Carbon isotope discrimination and photosynthesis. Annu. Rev. Plant Physiol. Plant Mol. Biol. 40, 503–537. doi: 10.1146/annurev.pp.40.060189.002443
Farquhar, G. D., O'Leary, M. H., and Berry, J. A. (1982). On the relationship between carbon isotope discrimination and the intercellular carbon dioxide concentration in leaves. Aust. J. Plant Physiol. 9, 121–137. doi: 10.1071/PP9820121
Ferrio, J. P., Araus, J. L., Buxó, R., Voltas, J., and Bort, J. (2005). Water management practices and climate in ancient agriculture: inferences from the stable isotope composition of archaeobotanical remains. Veget. Hist. Archaeobot. 14, 510–517. doi: 10.1007/s00334-005-0062-2
Fideghelli, C., and De Salvador, F. R. (2009). World hazelnut situation and perspectives. Acta Horticult. 845, 39–52. doi: 10.17660/ActaHortic.2009.845.2
France, R. (1996). Carbon isotope ratios in logged and unlogged boreal forests: examination of the potential for determining wildlife habitat use. Environ. Manage. 20, 249–255. doi: 10.1007/BF01204009
Gaillard, M.-J. (1984). “Water-level changes, climate and human impact: a palaeohydrological study of Krageholm lake (Scania, southern Sweden),” in Climatic Changes on a Yearly to Millennial Basis: Geological, Historical and Instrumental Records, eds N.-A. Mörner, and W. Karlén (Dordrecht: Springer Netherlands), 147–154.
Giesecke, T., Bennett, K. D., Birks, H. J. B., Bjune, A. E., Bozilova, E., Feurdean, A., et al. (2011). The pace of Holocene vegetation change – testing for synchronous developments. Quat. Sci. Rev. 30, 2805–2814. doi: 10.1016/j.quascirev.2011.06.014
Girona, J., Cohen, M., Mata, M., Marsal, J., and Miravete, C. (1994). Physiological, growth and yield responses of hazelnut (Corylus avellana L.) to different irrigation regimes. Acta Horticult. 351, 463–472. doi: 10.17660/ActaHortic.1994.351.50
Graham, H. V., Patzkowsky, M. E., Wing, S. L., Parker, G. G., Fogel, M. L., and Freeman, K. H. (2014). Isotopic characteristics of canopies in simulated leaf assemblages. Geochim. Cosmochim. Acta 144, 82–95. doi: 10.1016/j.gca.2014.08.032
Hagerup, O. (1942). The Morphology and Biology of the Corylus-Fruit. I kommission hos E. Copenhagen: Munksgaard.
Hellman, S. (2007). Validating and testing the landscape reconstruction algorithm in Southern Sweden - towards quantitative reconstruction of past vegetation (Ph.D. dissertation). Linnaeus University, Kalmar, Sweden.
Holguin, A., Charles, M., Mithen, S., and Schulting, R. (2022). In a nutshell: using structural and chemical changes to establish the charring conditions of archaeological hazelnut shells. J. Archaeol. Sci. 144, 105623. doi: 10.1016/j.jas.2022.105623
Huntley, B., and Birks, H. J. B. (1983). An Atlas of Past and Present Pollen Maps for Europe : 0-13,000 Years Ago. Cambridge: Cambridge University Press.
Jones, G. (2000). “Evaluating the importance of cultivation and collection in Neolithic Britain,” in Plants in Neolithic Britain and Beyond, ed A. S. Fairbairn (Oxford: Oxbow Books), 79–84.
Kohn, M. J. (2010). Carbon isotope compositions of terrestrial C3 plants as indicators of (paleo)ecology and (paleo)climate. Proc. Nat. Acad. Sci. U. S. A. 107, 19691–19695. doi: 10.1073/pnas.1004933107
Külahçilar, A., Tonkaz, T., and Bostan, S. Z. (2018). Effect of irrigation regimes by mini sprinkler on yield and pomological traits in ‘Tombul' hazelnut. Acta Hortic. 1226, 301–308. doi: 10.17660/ActaHortic.2018.1226.45
Lagerås, P., and Fredh, E. D. (2020). Long-term development of landscape openness and arable land use in an agricultural region of southern Sweden: the potential of REVEALS estimates using pollen records from wells. Veget. Hist. Archaeobot. 29, 113–124. doi: 10.1007/s00334-019-00756-z
Larsson, L., and Sjöström, A. (2010). Mesolithic research in the bog Rönneholms mosse, southern Sweden. Mesolithic Miscellany 21, 2–9.
Licursi, D., Antonetti, C., Fulignati, S., Vitolo, S., Puccini, M., Ribechini, E., et al. (2017). In-depth characterization of valuable char obtained from hydrothermal conversion of hazelnut shells to levulinic acid. Bioresour. Technol. 244, 880–888. doi: 10.1016/j.biortech.2017.08.012
Mingeau, M., Ameglio, T., Pons, B., and Rousseau, P. (1994). Effects of water stress on development growth and yield of hazelnut trees. Acta Horticult. 351, 305–314. doi: 10.17660/ActaHortic.1994.351.33
Müller, C., Hethke, M., Riedel, F., and Helle, G. (2020). Inter- and intra-tree variability of carbon and oxygen stable isotope ratios of modern pollen from nine European tree species. PLoS ONE 15, e0234315. doi: 10.1371/journal.pone.0234315
O'Dwyer, R., Marquer, L., Trondman, A.-K., and Jönsson, A. M. (2021). Spatially continuous land-cover reconstructions through the holocene in Southern Sweden. Ecosystems 24, 1450–1467. doi: 10.1007/s10021-020-00594-5
Perry, D. (1999). Vegetative tissues from mesolithic sites in the Northern Netherlands. Curr. Anthropol. 40, 231–237. doi: 10.1086/200008
Portarena, S., Gavrichkova, O., Brugnoli, E., Battistelli, A., Proietti, S., Moscatello, S., et al. (2022). Carbon allocation strategies and water uptake in young grafted and own-rooted hazelnut (Corylus avellana L.) cultivars. Tree Physiol. 42, 939–957. doi: 10.1093/treephys/tpab164
Regnell, M. (2012). Plant subsistence and environment at the Mesolithic site Tågerup, southern Sweden: new insights on the “Nut Age.” Veget. Hist. Archaeobot. 21, 1–16. doi: 10.1007/s00334-011-0299-x
Roberts, J., Hopkins, R., and Morecroft, M. (1999). Towards a predictive description of forest canopies from litter properties. Funct. Ecol. 13, 265–272. doi: 10.1046/j.1365-2435.1999.00312.x
Schleser, G. H. (1992). (delta)(13)C pattern in a forest tree as an indicator of carbon transfer in trees. Ecology 73, 1922–1925. doi: 10.2307/1940045
Sjöström, A. (1997). Ringsjöholm: a Boreal–Early Atlantic Settlement in Central Scania, Sweden. Lund Archaeol. Rev. 3, 5–20.
Sjöström, A. (2004). Rönneholm 6-10, 12, 14 och 15: Arkeologisk undersökning av ett mesolitiskt boplatskomplex i Rönneholms mosse: Hassle 32:18, Stehag socken, Eslövs kommun, Skåne, Rapporter från Institutionen för arkeologi och antikens historia, Lunds universitet. Lund: Institutionen för Arkeologi och Antikens Historia, Lunds Universitet.
Sjöström, A. (2013). Slabälta 1 - en boplats från sen maglemosetid vid Ageröds mosse: Arkeologisk undersökning 2012: Munkarp 2:3, Munkarp socken, Höörs kommun, Skåne, Rapporter från Institutionen för arkeologi och antikens historia, Lunds universitet. Lund: Institutionen för Arkeologi och Antikens Historia, Lunds Universitet.
Tombesi, A., and Rosati, A. (1997). Hazelnut response to water levels in relation to productive cycle. Acta Horticult. 445, 269-278. doi: 10.17660/ActaHortic.1997.445.36
van der Merwe, N. J., and Medina, E. (1991). The canopy effect, carbon isotope ratios and foodwebs in amazonia. J. Archaeol. Sci. 18, 249–259. doi: 10.1016/0305-4403(91)90064-V
Warren, C. R., McGrath, J. F., and Adams, M. A. (2001). Water availability and carbon isotope discrimination in conifers. Oecologia 127, 476–486. doi: 10.1007/s004420000609
Wastegård, S. (2022). The Holocene of Sweden – a review. GFF 144, 126–149. doi: 10.1080/11035897.2022.2086290
Yao, Q., and Mehlenbacher, S. A. (2000). Heritability, variance components and correlation of morphological and phenological traits in hazelnut. Plant Breed. 119, 369–381. doi: 10.1046/j.1439-0523.2000.00524.x
Keywords: archaeology, environmental reconstruction, δ13C values, Mesolithic, Sweden
Citation: Styring AK, Jirdén E, Lagerås P, Larsson M, Sjöström A and Ljung K (2024) Carbon isotope values of hazelnut shells: a new proxy for canopy density. Front. Environ. Archaeol. 3:1351411. doi: 10.3389/fearc.2024.1351411
Received: 06 December 2023; Accepted: 09 January 2024;
Published: 29 February 2024.
Edited by:
Xinyi Liu, Washington University in St. Louis, United StatesReviewed by:
Yu Dong, Shandong University, ChinaNicasio T. Jiménez-Morillo, University of Evora, Portugal
Copyright © 2024 Styring, Jirdén, Lagerås, Larsson, Sjöström and Ljung. This is an open-access article distributed under the terms of the Creative Commons Attribution License (CC BY). The use, distribution or reproduction in other forums is permitted, provided the original author(s) and the copyright owner(s) are credited and that the original publication in this journal is cited, in accordance with accepted academic practice. No use, distribution or reproduction is permitted which does not comply with these terms.
*Correspondence: Karl Ljung, karl.ljung@geol.lu.se; Amy K. Styring, amy.styring@arch.ox.ac.uk